


II-72
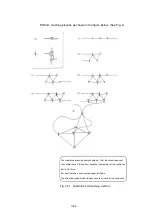
2-16-2
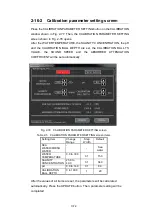
Calibration parameter setting screen
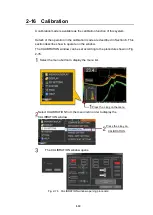
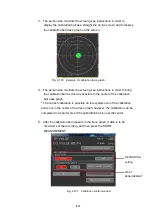
Press the CALIBRATION PARAMETER SETTING button on the CALIBRATION
window shown in Fig. 2-77. Then, the CALIBRATION PARAMETER SETTING
screen shown in Fig. 2-78 opens.
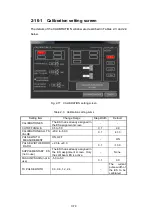
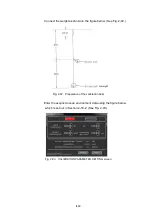
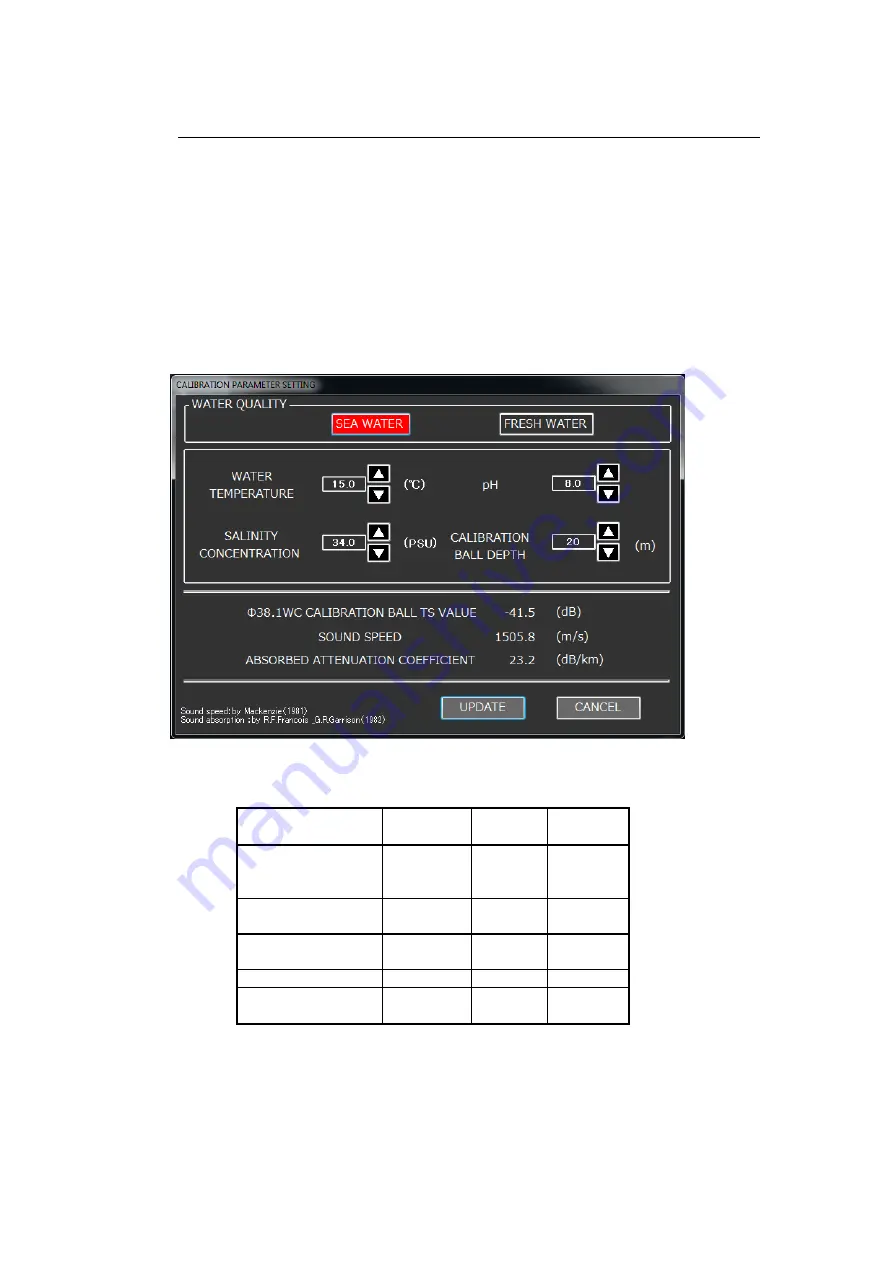
After the WATER TEMPERATURE, the SALINITY CONCENTRATION, the pH
and the CALIBRATION BALL DEPTH are set, the CALIBRATION BALL TS
VALUE, the SOUND SPEED and the ABSORBED ATTENUATION
COEFFICIENT will be set automatically.
Fig. 2-78
CALIBRATION PARAMETER SETTING screen
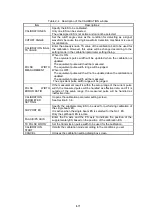
Table 2-5
CALIBRATION PARAMETER SETTING screen items
Setting Item
Change
Range
Step
Width
Default
SEA
WATER/FRESH
WATER
-
-
Sea
water
WATER
TEMPERATURE
0.0 to 30.0
0.1
15.0
SALINITY
CONCENTRATION
25.0 to
40.0
0.1
34.0
pH
0.0 to 14.0
0.1
8.0
CALIBRATION
BALL DEPTH
0 to 1000
1
20
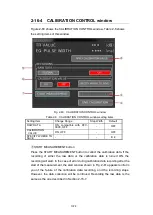
After the values of all items are set, the parameters will be calculated
automatically. Press the UPDATE button. Then, parameter setting will be
completed.
Содержание KSE-310
Страница 1: ...KSE 310 TYPE FISH SIZING ECHO SOUNDER Instruction Manual Ver 5 04E SONIC CORPORATION ...
Страница 2: ... MEMO ...
Страница 55: ...II 45 Fig 2 50 Biomass display procedure The biomass is displayed in the DISPLAY ES area Displays the biomass ...
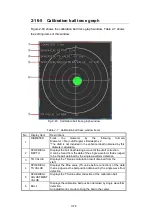
Страница 113: ...II 103 Note The fish length graph TS graph and trace graph are valid only at frequencies of 38 70 and 120 kHz ...
Страница 115: ...II 105 Note The fish length graph TS graph and trace graph are valid only at frequencies of 38 70 and 120 kHz ...
Страница 117: ...II 107 Note The fish length graph TS graph and trace graph are valid only at frequencies of 38 70 and 120 kHz ...
Страница 119: ...II 109 Note The fish length graph TS graph and trace graph are valid only at frequencies of 38 70 and 120 kHz ...
Страница 121: ...II 111 Note The fish length graph TS graph and trace graph are valid only at frequencies of 38 70 and 120 kHz ...
Страница 123: ...II 113 Note The fish length graph TS graph and trace graph are valid only at frequencies of 38 70 and 120 kHz ...
Страница 163: ...III 153 ...
Страница 166: ...III 156 3 2 1 CURSOR CONTROL This is described in Section 2 9 ...
Страница 186: ...Ⅲ IV 14 Fig 4 13 NET DEPTH Display Method dialog ...
Страница 196: ......


