


II-16
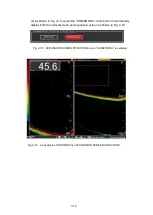
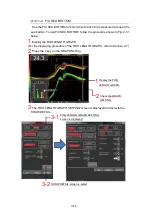
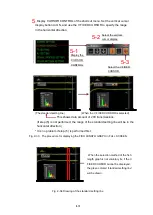
Fig. 2-21
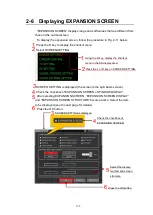
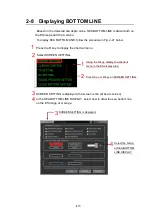
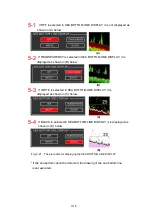
The procedure for displaying the SEA BOTTOM LINE DISPLAY
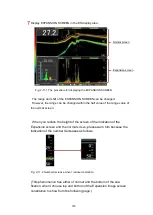
* If the sea bottom cannot be detected, the drawing of the sea bottom line
is not executed.
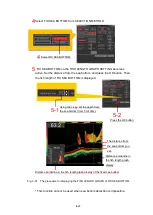
If TRANSPARENCY is selected in SEA BOTTOM LINE DISPLAY, it is
displayed as shown in (B) below.
(D)
If BLACK is selected in SEA BOTTOM LINE DISPLAY, it is displayed as
shown in (D) below.
(A)
(B)
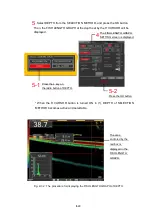
If WHITE is selected in SEA BOTTOM LINE DISPLAY, it is
displayed as shown in (C) below.
(C)
5-1
5-2
5-3
5-4
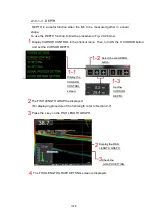
If OFF is selected in SEA BOTTOM LINE DISPLAY, it is not displayed as
shown in (A) below.
Содержание KSE-310
Страница 1: ...KSE 310 TYPE FISH SIZING ECHO SOUNDER Instruction Manual Ver 5 04E SONIC CORPORATION ...
Страница 2: ... MEMO ...
Страница 55: ...II 45 Fig 2 50 Biomass display procedure The biomass is displayed in the DISPLAY ES area Displays the biomass ...
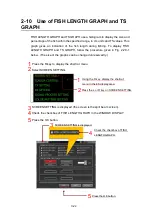
Страница 113: ...II 103 Note The fish length graph TS graph and trace graph are valid only at frequencies of 38 70 and 120 kHz ...
Страница 115: ...II 105 Note The fish length graph TS graph and trace graph are valid only at frequencies of 38 70 and 120 kHz ...
Страница 117: ...II 107 Note The fish length graph TS graph and trace graph are valid only at frequencies of 38 70 and 120 kHz ...
Страница 119: ...II 109 Note The fish length graph TS graph and trace graph are valid only at frequencies of 38 70 and 120 kHz ...
Страница 121: ...II 111 Note The fish length graph TS graph and trace graph are valid only at frequencies of 38 70 and 120 kHz ...
Страница 123: ...II 113 Note The fish length graph TS graph and trace graph are valid only at frequencies of 38 70 and 120 kHz ...
Страница 163: ...III 153 ...
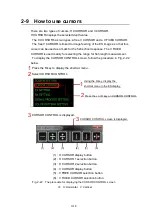
Страница 166: ...III 156 3 2 1 CURSOR CONTROL This is described in Section 2 9 ...
Страница 186: ...Ⅲ IV 14 Fig 4 13 NET DEPTH Display Method dialog ...
Страница 196: ......


