


II-114
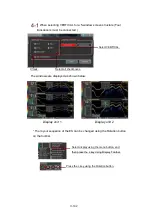
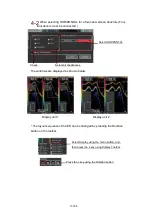
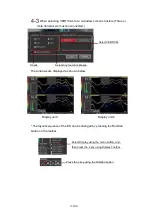
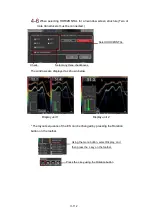
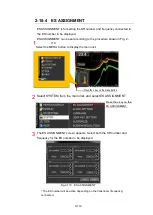
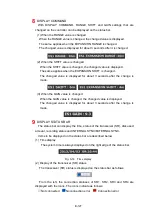
The
windows are displayed as shown below.
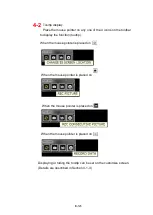
Display unit 1
Display unit 2
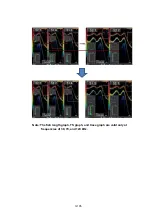
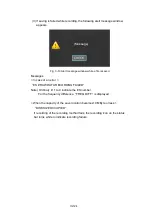
* The layout sequence of the ES can be changed by pressing the Rotation
button on the toolbar.
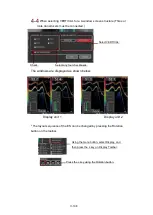
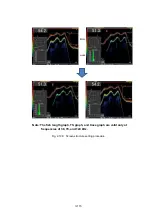
When selecting a 2-window screen structure (Two or more transducers
must be connected.)
Regardless of which
button is pressed, the
ES are displayed in the
same layout.
Select any two checkboxes.
Using the menu button, select Display, and
then press the L key on Display Toolbar.
Press the L key using the Rotation button.
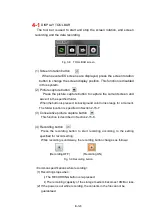
Check.
Содержание KSE-310
Страница 1: ...KSE 310 TYPE FISH SIZING ECHO SOUNDER Instruction Manual Ver 5 04E SONIC CORPORATION ...
Страница 2: ... MEMO ...
Страница 55: ...II 45 Fig 2 50 Biomass display procedure The biomass is displayed in the DISPLAY ES area Displays the biomass ...
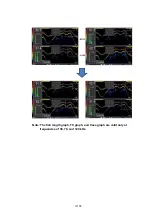
Страница 113: ...II 103 Note The fish length graph TS graph and trace graph are valid only at frequencies of 38 70 and 120 kHz ...
Страница 115: ...II 105 Note The fish length graph TS graph and trace graph are valid only at frequencies of 38 70 and 120 kHz ...
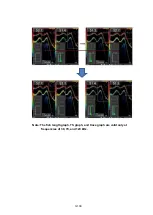
Страница 117: ...II 107 Note The fish length graph TS graph and trace graph are valid only at frequencies of 38 70 and 120 kHz ...
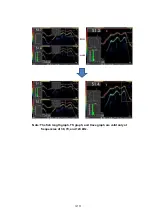
Страница 119: ...II 109 Note The fish length graph TS graph and trace graph are valid only at frequencies of 38 70 and 120 kHz ...
Страница 121: ...II 111 Note The fish length graph TS graph and trace graph are valid only at frequencies of 38 70 and 120 kHz ...
Страница 123: ...II 113 Note The fish length graph TS graph and trace graph are valid only at frequencies of 38 70 and 120 kHz ...
Страница 163: ...III 153 ...
Страница 166: ...III 156 3 2 1 CURSOR CONTROL This is described in Section 2 9 ...
Страница 186: ...Ⅲ IV 14 Fig 4 13 NET DEPTH Display Method dialog ...
Страница 196: ......


