


II-49
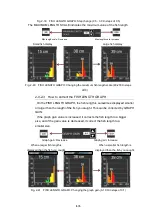
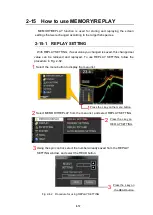
SELECTION METHOD
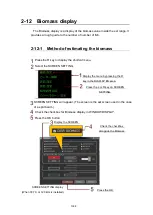
For selecting the method to specify the calculation range of the biomass.
・
SYNC GRAPH: In the case of a split beam, the biomass value
corresponding to the display selection range on the fish
length graph is displayed, while in the case of a single beam,
the biomass value within the “any” selection border is
displayed.
・
DEPTH: The biomass value of the area enclosed by the H CURSOR and the
V FIXED CURSOR is displayed. If a H CURSOR is not set, this item
cannot be selected. If a V FIXED CURSOR is not set, the full screen
and the display range will be the same as each other.
・
FIX SEA BOTTOM: The biomass value is displayed over an arbitrary
distance, using the sea bottom surface as a standard.
・
FULL SCREEN: The biomass over the range to the right of the V FIXED
CURSOR is displayed.
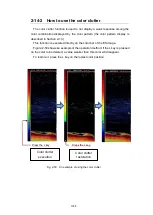
FIX SEA BOTTOM
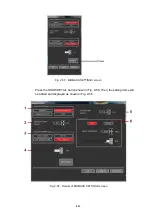
When the selection range is FIX SEA BOTTOM, the detection range is the sea
bottom. If the selection method is FIX SEA BOTTOM, it will be active.
SEA BOTTOM OFFSET
This is the offset value of the integration of the sea bottom. This function is
disabled when the integration is less than the sea bottom.
THRESHOLD
The selected calculation algorithm for eliminating noise is either FLAT or
20LOG.
・
FLAT: This item uses the threshold value that is fixed to all data. The value
is fixed using the BASIC THRESHOLD.
・
20LOG: This item uses the threshold value that takes into consideration
TVG processing. The value is set using the BASIC THRESHOLD
DISTANCE.
・
BASIC THRESHOLD: When FLAT is selected for THRESHOLD, the basic
threshold value will be set. Unselected ES will be
inactive and the threshold cannot be set.
・
BASIC THRESHOLD DISTANCE: When 20LOG is selected for the
THRESHOLD, the BASIC THRESHOLD
Содержание KSE-310
Страница 1: ...KSE 310 TYPE FISH SIZING ECHO SOUNDER Instruction Manual Ver 5 04E SONIC CORPORATION ...
Страница 2: ... MEMO ...
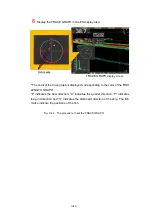
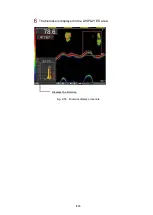
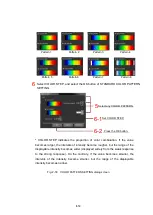
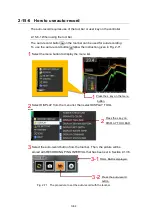
Страница 55: ...II 45 Fig 2 50 Biomass display procedure The biomass is displayed in the DISPLAY ES area Displays the biomass ...
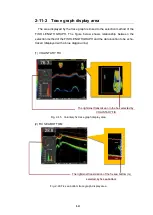
Страница 113: ...II 103 Note The fish length graph TS graph and trace graph are valid only at frequencies of 38 70 and 120 kHz ...
Страница 115: ...II 105 Note The fish length graph TS graph and trace graph are valid only at frequencies of 38 70 and 120 kHz ...
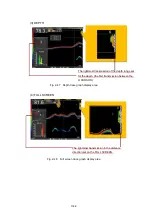
Страница 117: ...II 107 Note The fish length graph TS graph and trace graph are valid only at frequencies of 38 70 and 120 kHz ...
Страница 119: ...II 109 Note The fish length graph TS graph and trace graph are valid only at frequencies of 38 70 and 120 kHz ...
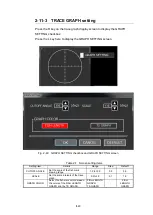
Страница 121: ...II 111 Note The fish length graph TS graph and trace graph are valid only at frequencies of 38 70 and 120 kHz ...
Страница 123: ...II 113 Note The fish length graph TS graph and trace graph are valid only at frequencies of 38 70 and 120 kHz ...
Страница 163: ...III 153 ...
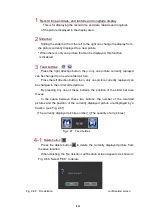
Страница 166: ...III 156 3 2 1 CURSOR CONTROL This is described in Section 2 9 ...
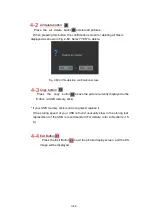
Страница 186: ...Ⅲ IV 14 Fig 4 13 NET DEPTH Display Method dialog ...
Страница 196: ......


