


II-97
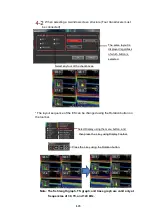
*The ES layout sequence can be changed by pressing the Rotation button on
the toolbar.
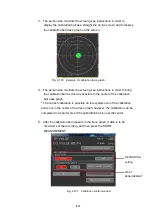
Select Display using the menu button, and
then press the L key
on Display Toolbar.
Press the L key using the Rotation button.
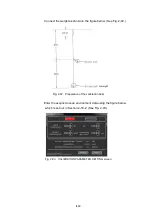
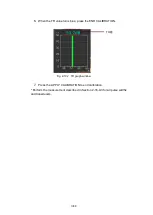
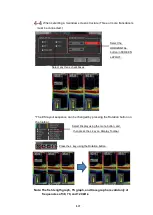
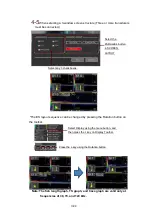
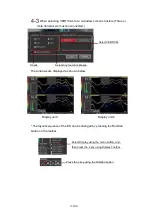
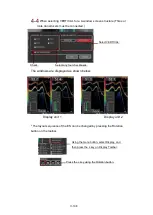
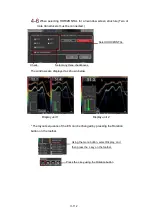
When selecting a 3-window screen structure (Three or more transducers
must be connected.)
Select the
HORIZONTAL
button in SCREEN
LAYOUT
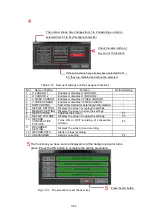
Select any three checkboxes.
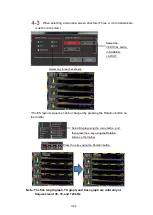
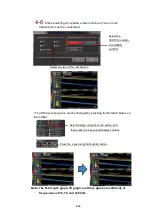
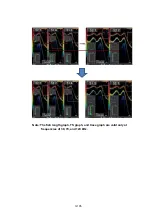
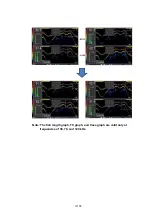
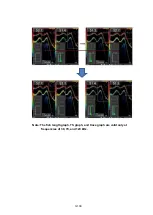
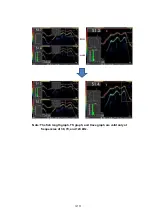
Note: The fish length graph, TS graph, and trace graph are valid only at
frequencies of 38, 70, and 120 kHz.
Содержание KSE-310
Страница 1: ...KSE 310 TYPE FISH SIZING ECHO SOUNDER Instruction Manual Ver 5 04E SONIC CORPORATION ...
Страница 2: ... MEMO ...
Страница 55: ...II 45 Fig 2 50 Biomass display procedure The biomass is displayed in the DISPLAY ES area Displays the biomass ...
Страница 113: ...II 103 Note The fish length graph TS graph and trace graph are valid only at frequencies of 38 70 and 120 kHz ...
Страница 115: ...II 105 Note The fish length graph TS graph and trace graph are valid only at frequencies of 38 70 and 120 kHz ...
Страница 117: ...II 107 Note The fish length graph TS graph and trace graph are valid only at frequencies of 38 70 and 120 kHz ...
Страница 119: ...II 109 Note The fish length graph TS graph and trace graph are valid only at frequencies of 38 70 and 120 kHz ...
Страница 121: ...II 111 Note The fish length graph TS graph and trace graph are valid only at frequencies of 38 70 and 120 kHz ...
Страница 123: ...II 113 Note The fish length graph TS graph and trace graph are valid only at frequencies of 38 70 and 120 kHz ...
Страница 163: ...III 153 ...
Страница 166: ...III 156 3 2 1 CURSOR CONTROL This is described in Section 2 9 ...
Страница 186: ...Ⅲ IV 14 Fig 4 13 NET DEPTH Display Method dialog ...
Страница 196: ......


