


II-10
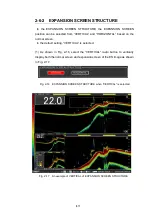
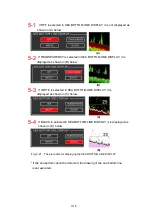
(2) EXPANSION SCREEN when FIX SEA BOTTOM is selected
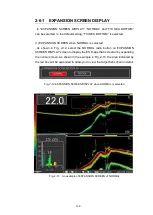
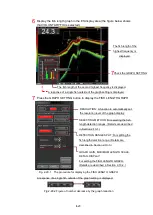
As shown Fig. 2-14, select the FIX SEA BOTTOM radio button on EXPANSION
SCREEN DIAPLAY screen. Then, the ES image based on the detected sea
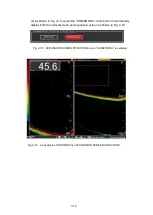
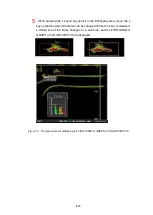
bottom position is displayed. Like the example shown in Fig. 2-15, if the distance
from the sea bottom is set to 10m, the section indicated by the red box will be
expanded to allow you to view the fish school in detail near the sea bottom.
Fig. 2-14 EXPANSION SCREEN DISPLAY when FIX SEA BOTTOM is selected.
Fig. 2-15
An example of EXPANSION SCREEN of FIX SEA BOTTOM.
Содержание KSE-310
Страница 1: ...KSE 310 TYPE FISH SIZING ECHO SOUNDER Instruction Manual Ver 5 04E SONIC CORPORATION ...
Страница 2: ... MEMO ...
Страница 55: ...II 45 Fig 2 50 Biomass display procedure The biomass is displayed in the DISPLAY ES area Displays the biomass ...
Страница 113: ...II 103 Note The fish length graph TS graph and trace graph are valid only at frequencies of 38 70 and 120 kHz ...
Страница 115: ...II 105 Note The fish length graph TS graph and trace graph are valid only at frequencies of 38 70 and 120 kHz ...
Страница 117: ...II 107 Note The fish length graph TS graph and trace graph are valid only at frequencies of 38 70 and 120 kHz ...
Страница 119: ...II 109 Note The fish length graph TS graph and trace graph are valid only at frequencies of 38 70 and 120 kHz ...
Страница 121: ...II 111 Note The fish length graph TS graph and trace graph are valid only at frequencies of 38 70 and 120 kHz ...
Страница 123: ...II 113 Note The fish length graph TS graph and trace graph are valid only at frequencies of 38 70 and 120 kHz ...
Страница 163: ...III 153 ...
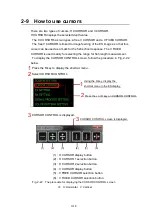
Страница 166: ...III 156 3 2 1 CURSOR CONTROL This is described in Section 2 9 ...
Страница 186: ...Ⅲ IV 14 Fig 4 13 NET DEPTH Display Method dialog ...
Страница 196: ......


