LISST-
Tau User’s Manual
Operation Details
Page 9
3.
Using the LISST-Tau software
Introduction
The LISST-Tau software is a simple tool used for:
1. Viewing Data
2. Saving data to the computer in a text file
3. Configuring the instrument (setting the clock, measure clean-
water baseline, etc.)
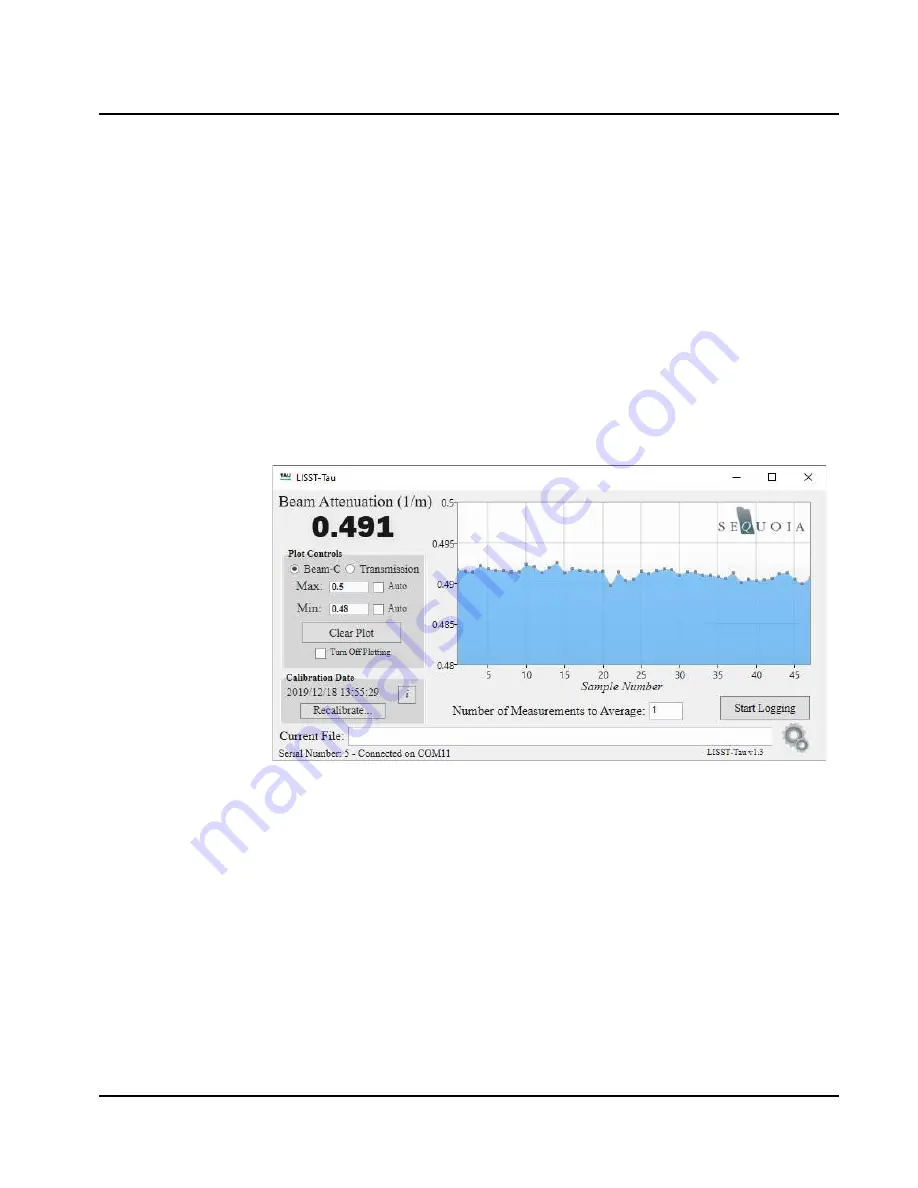
Viewing Data
After connecting the LISST-Tau instrument (also see
on page 15), data will automatically be displayed to the
screen. The Type of data displayed, beam attenuation or optical
transmission, can be selected using radio buttons the left side of the
window. The most recent value is displayed as a number in the upper
left of the window. The last 15 minutes of data will be displayed in the
strip chart.
In the ‘Plot Controls’ group box, you can customize the scale of the
current plot, clear out the existing data, or turn off plotting all together.
Turning off the plotting option may be useful if computer resources are
limited.
Saving Data
Data can be saved to a text file by selecting the ‘Start Logging’ button.
You will be prompted for a location to save the data. After selecting a
location and filename, data will be continually saved to this file until
‘Stop Logging’ is selected or the program is closed. The plot color will
change to green, indicating this data was saved to a file.


