DefensePro User Guide
Real-Time Security Reporting
276
Document ID: RDWR-DP-V0602_UG1201
Use the Security Dashboard to analyze activity and security events in the network, identify security
trends, and analyze risk.
You can view Dashboard information for individual DefensePro devices, all devices in a site, or all
devices in the network. The Dashboard monitoring display automatically refreshes providing ongoing
real-time analysis of the system. You can select the ports to view inbound or outbound traffic in
specific portions of your network, and you can choose the recent period of time for which to display
data.
You can configure the following Security Monitoring client preferences:
•
The display refresh rate. The default is 15 seconds.
•
How long an attack continues to be displayed after the attack has ended.
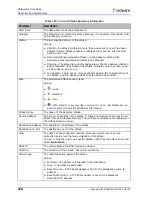
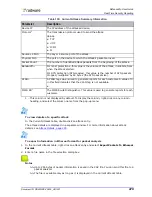
The Dashboard displays an attacks radar, and Drop Intensity indicator.
The attacks radar displays current and recent attacks:
•
Each arrowhead in the radar represents a separate attack.
•
A flashing arrowhead represents an ongoing attack.
•
The color of the arrowhead indicates the attack category. The category represents the type of
protection that the attack violates. When you double-click an arrowhead, the corresponding
attack-characteristics-and-information dialog box is displayed.
•
The categories in the Security Dashboard are as follows:
—
DDoS—Represents attacks identified by the following protection types: Behavioral DoS, SYN
Flood, and DoS Shield.
—
Server Cracking—Represents attacks identified by Server Cracking Protection.
—
Intrusion—Represents attacks identified by Intrusion Protection.
—
Application DDoS—Represents attacks identified by HTTP Flood Protection.
—
Stateful ACL—Represents attacks identified by Stateful ACL Protection.
—
Packet Anomalies—Represents attacks identified by Packet Anomaly Protection.
—
Network Scans—Represents attacks identified by Anti-Scanning Protection.
—
Black & White Lists—Represents traffic identified by Black List Protection.
•
The position of the attack in the radar indicates the attack risk. Each band in the radar, moving
inwards from the outer edge, represents increasing risk—info, low, medium, and high.
•
You can display summary information for an attack by clicking on the corresponding arrowhead,
and you can view additional attack details by double-clicking the arrowhead.
Note:
The summary information displayed in the attacks radar is also presented in the Current
Attacks table.
The Drop Intensity counter provides an indication of the level of discarded traffic during attacks,
relative to the maximum bandwidth of the device (per license).
To display Security Dashboard information
1. In the Security Monitoring perspective navigation pane Security tab, select the DefensePro
device, or site, for which to display data.
2. Select the Security Dashboard tab.
Содержание DefensePro 6.02
Страница 1: ...DefensePro User Guide Software Version 6 02 Document ID RDWR DP V0602_UG1201 January 2012 ...
Страница 2: ...DefensePro User Guide 2 Document ID RDWR DP V0602_UG1201 ...
Страница 20: ...DefensePro User Guide 20 Document ID RDWR DP V0602_UG1201 ...
Страница 28: ...DefensePro User Guide Table of Contents 28 Document ID RDWR DP V0602_UG1201 ...
Страница 116: ...DefensePro User Guide Device Network Configuration 116 Document ID RDWR DP V0602_UG1201 ...
Страница 256: ...DefensePro User Guide Managing Device Operations and Maintenance 256 Document ID RDWR DP V0602_UG1201 ...
Страница 274: ...DefensePro User Guide Monitoring DefensePro Devices and Interfaces 274 Document ID RDWR DP V0602_UG1201 ...
Страница 302: ...DefensePro User Guide Real Time Security Reporting 302 Document ID RDWR DP V0602_UG1201 ...
Страница 308: ...DefensePro User Guide Administering DefensePro 308 Document ID RDWR DP V0602_UG1201 ...
Страница 324: ...DefensePro User Guide Troubleshooting 324 Document ID RDWR DP V0602_UG1201 ...

