Page 332 ·
Robotics with the Boe-Bot
√
Modify the
FOR
...
NEXT
loop in Program Listing FrequencySweep.bs2 so that it
steps in increments of 250 and includes the upper and lower limits of both
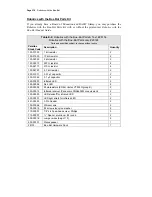
detectors. Based on the data in the example shown in Figure G-1, the start, end,
and step values of the
FOR
...
NEXT
loop would be modified as follows:
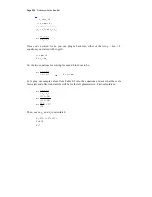
FOR irFrequency = 36500 to 42500 STEP 250
√
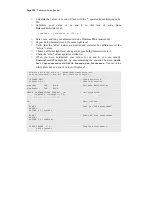
Re-run your modified FrequencySweep.bs2, and press
Enter
again.
√
Record the data for left and right sides in separate spreadsheets.
√
Press the
Enter
key again and record the next set of data points.
√
Repeat this process three more times. When finished, you will have five sets of
data points for each sensor in separate spreadsheets for this one frequency.
√
Back the Boe-Bot up 2.5 cm. Now your Boe-Bot’s IR detectors will be 5 cm
from the paper target.
√
Record five more data sets at this distance.
√
Keep on backing up the Boe-Bot by 2.5 cm at a time and recording the five
frequency sweep data sets between each distance adjustment.
√
When the Boe-Bot has been backed up by 20 cm, the frequency sweep will
display mostly, if not all ”No” regions. When the frequency sweep is all ”No”, it
means no object is detected at any frequency within the sweep.
By careful scrutiny of the spreadsheets and process of elimination, you can determine the
optimum frequency for each IR pair for each zone. Customizing for up to eight zones
can be done without any restructuring of the Boe-Bot navigational routines. If you were
to customize for 15 zones, this would entail 30 one millisecond
FREQOUT
commands.
That won’t gracefully fit between servo pulses. One solution would be to take 15
measurements every other pulse.
How to determine the best frequencies for the left sensor is discussed here. Keep in mind
you’ll have to repeat this process for the right sensor. This example assumes you are
looking for six zones (zero through five).
√
Start by examining the data points taken when the Boe-Bot was furthest from the
paper target. There probably won’t be any sets of data points that are all “Yes”
readings at the same frequency. Check the data points for the next 2.5 cm
towards the paper target. Presumably, you will see a set of four or five “Yes”

