


Operator's Manual
Issue 14
/
Mar 2016 / UMC0071
Mercury
iPS
©2016 Oxford Instruments NanoScience. All rights reserved.
Page
38
5 By default, the Plot page displays a scale on the Y-axis only. To add the X-axis scale, tap
once on the bottom of the X-axis.
6 Double tap the plot page to reveal 2 buttons (not shown here). Tap
Settings
to return to the
Plot Configuration
page. Tap
Exit
to close the plot and return to the home page.
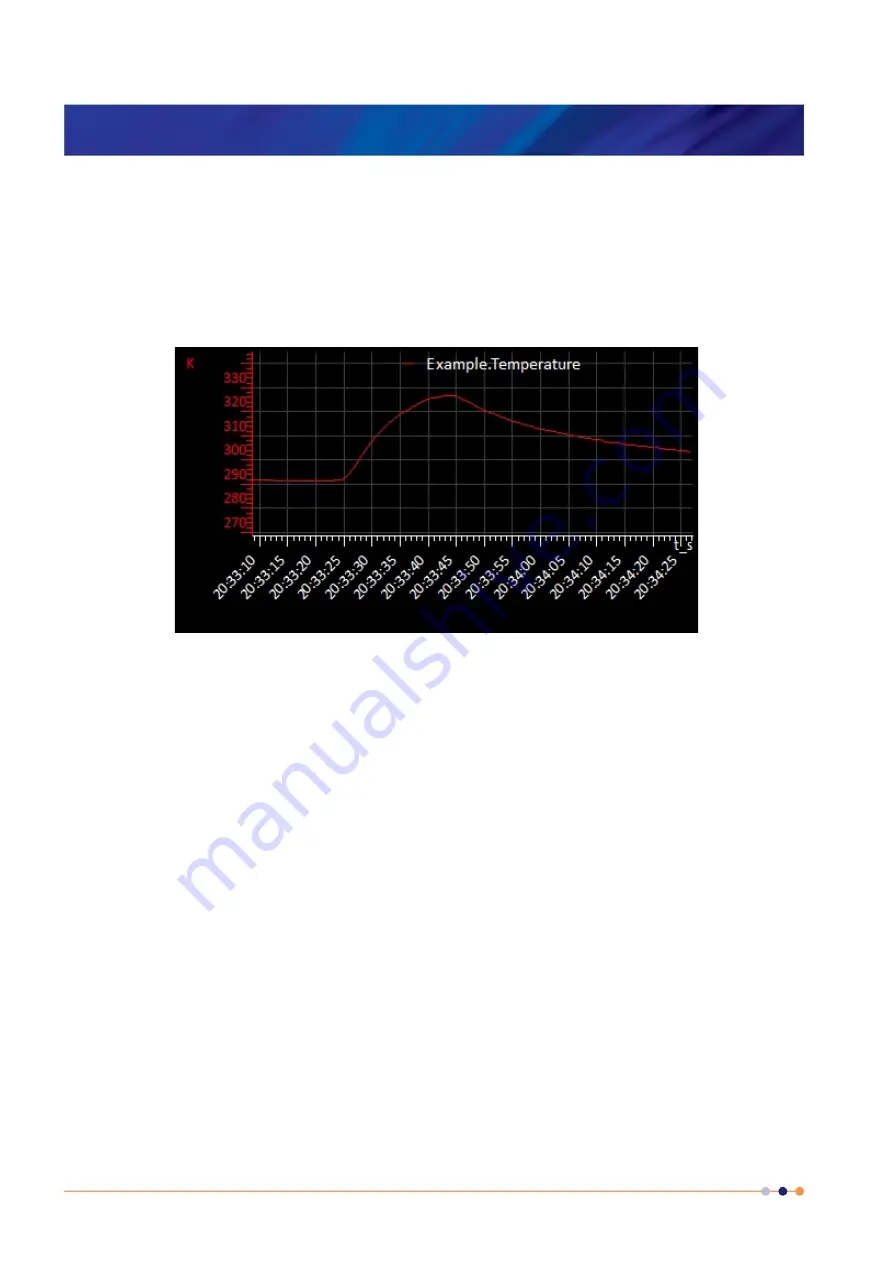
3.6.2 Scaling a plot
To adjust the scaling of a plot:
1 Place a finger on the region of interest of the plot. The re-scaled plot will be centred around
this position.
2 Drag the finger to zoom in and out around the area of interest:
(a) Drag the finger to the right to expand the X-axis (zoom in).
(b) Drag the finger to the left to contract the X-axis (zoom out).
(c) Drag the finger up to expand the Y-axis (zoom in).
(d) Drag the finger down to contract the Y-axis (zoom out).
These motions can be combined. For example, dragging the finger towards the bottom right
corner expands the X-axis and contracts the Y-axis.
These instructions are summarised in the following diagram.
3 Double tap on a scale to return to the default scaling for that axis.


