10400455-002
©2008-14 Overland Storage, Inc.
198
SnapScale/RAINcloudOS 4.1 Administrator’s Guide
7 - System Monitoring
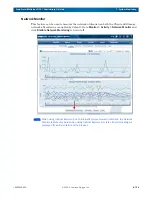
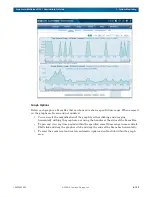
When you mouseover the usage bars, tool tip messages are displayed under the graph titles for
that bar. Depending on the type of bar (Combined, Input, or Output), the message shows
information about the bonded interface.
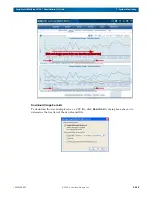
The buttons at the bottom of the page let you disable network monitoring, download the client
and storage network usage logs, manually refresh the data, or close the page.
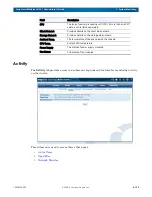
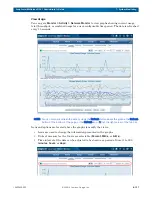
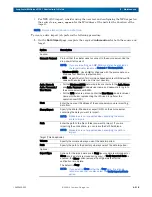
Different views are displayed by changing the selection of the icons:
•
Individual activity
– only a single node is selected using Select Nodes.
•
Total activity
– all nodes are selected using Select Nodes.
•
Individual throughput
– a single node (Select Nodes) and the Total Throughput icon
are selected.
•
Total throughput
– all nodes (Select Nodes) and the Total Throughput icon are
selected.
•
Combined activity
– only the Combined icon is selected.
•
Cluster-wide activity
– both the Total Throughput and Combined icons are selected.
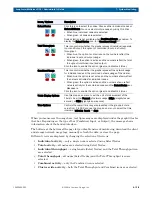
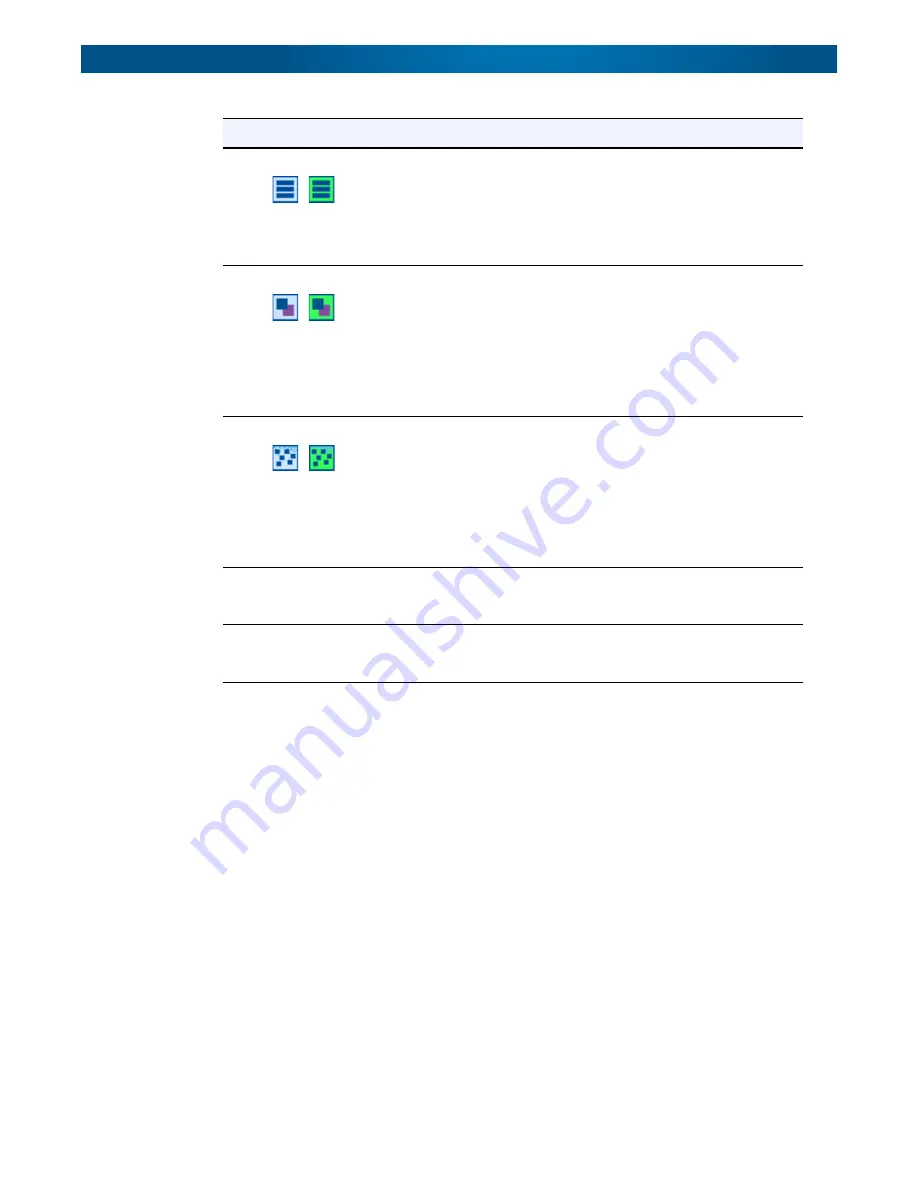
Icons / Options
Description
Select Nodes
Click this icon to select the nodes. Choose either individual nodes or
Select All Notes. You can select multiple nodes by using Ctrl+Click.
• When blue, individual nodes are selected.
• When green, all nodes are selected.
Node selection is not available when Combined Usage is enabled. To
display the Select Nodes icon, turn Combined Usage off.
Total Throughput
This icon controls whether the graphs represent individual (separate
Input and Output) throughput or combined (Input plus Output)
throughput.:
• When blue, the option is not active and the numbers reflect the
individual input and output usage.
• When green, the option is active and the numbers reflect the total
throughput (combined input and output).
Click the icon to enable the option (green) and disable it (blue).
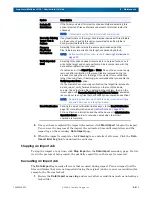
Combined Usage
This icon controls whether the graphs represent the network usage
for individual nodes or the combined network usage of the cluster:
• When blue, the option is not active and the numbers shown reflect
the network activities for individual nodes.
• When green, the option is active and the numbers shown reflect
network activity for the combined nodes and the Select Nodes icon
disappears.
Click the icon to enable the option (green) and disable it (blue).
Y-Axis Display Options
Use this drop-down menu to set the unit of measurement of the
Y-Axis to be either Percent of network usage, MB/s (megabytes per
second), or GB/s (gigabytes per second).
Time Options
Controls the overall time range represented in the graphs. Enter a
value from 1 to 999 and use the drop-down menu to select the time
interval of minutes, hours, or days.
Ind
All
Off
On
Off
On

