10400455-002
©2008-14 Overland Storage, Inc.
197
SnapScale/RAINcloudOS 4.1 Administrator’s Guide
7 - System Monitoring
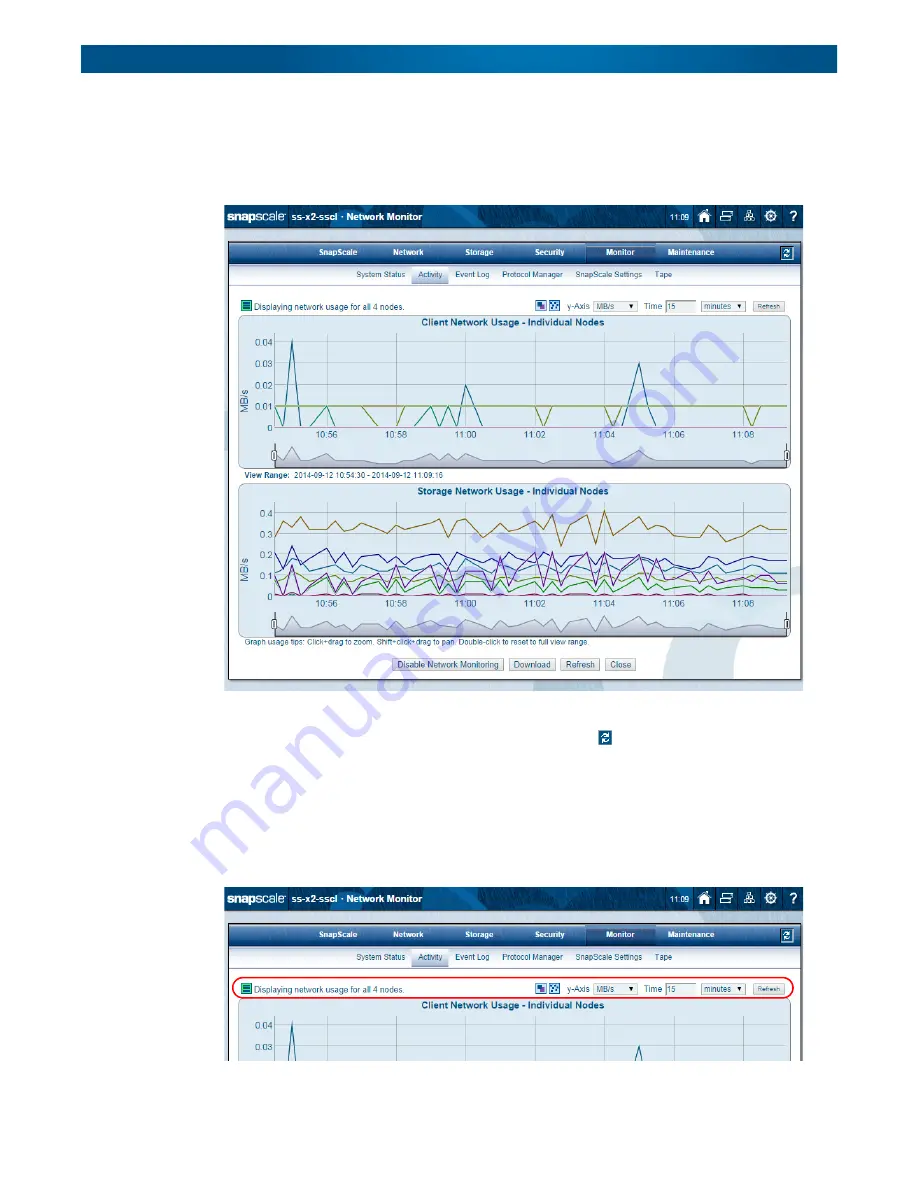
View Usage
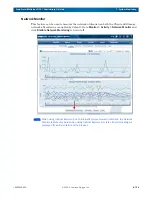
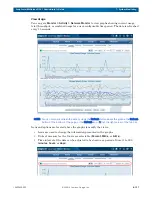
You can go to
Monitor > Activity > Network Monitor
to view graphs showing current usage,
total throughput, or combined usage for a user-configurable time period. The data is refreshed
every 15 seconds.
NOTE: You can manually refresh the data by using the Refresh button above the graphs, the Refresh
button at the bottom of the page, or the Refresh icon (
) at the right corner of the tab bar.
Icons and options are located above the graphs to modify the views:
•
Icons are used to change the information presented in the graphs.
•
Units of measure for the Y-axis are selectable (
Percent, MB/s,
or
GB/s
).
•
Time interval of the data can be adjusted to be shown as a period of time (1 to 999
minutes, hours,
or
days
).

