


086
www.ruggedaq.com
DATALOGGER
NI400
NI400
087
www.ruggedaq.com
DATALOGGER
NI400
NI400
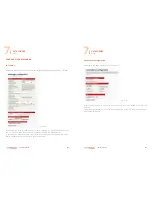
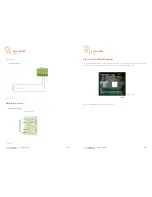
By clicking on this button you can select a widget to be added in the list of all available
buttons:
Since NI400 devices send data to Exosite portal using a custom protocol not all the
widgets could be used.
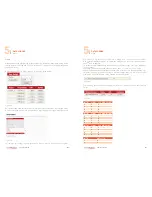
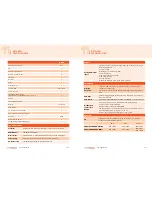
For data source visualization only the following widgets can be used:
Colum -Next Industries-
Gauge -Next Industries-
Image Overlay -Next Industries-
Line chart -Next Industries-
Table -Next Industries-
For generic info visualization (map, device list, event list, event log …) every widget
can be used.
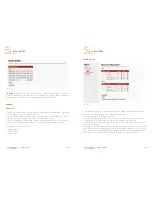
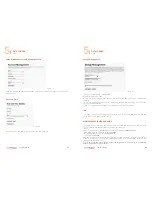
Once widget type is selected you have name it and than, by pressing on CONTINUE,
you can configure the widget with the following page:
This page may change depending on the type of selected widget, but they’re all
almost similar.
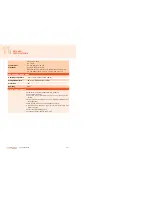
Here you have to select the data source that should be showed in the graph.
You can select more than one data source at the same time. The data source available
are grouped by device.
the field COUNT: with this field it is possible to set the max number of data point that
should be displayed in the graph. This field makes sense only for widgets that show
more data points at the same time (line and column chart), no sense for graph that
shows only last value like gauge and image overlay.
Refresh rate: the refreshing period of the graph
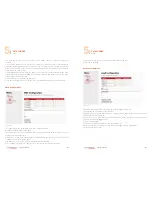
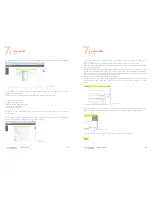
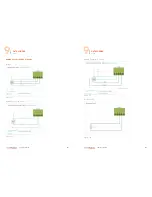
In this example a line chart -Next Industries- has been added and it has been config-
ured in order to show data source AN_1_A and AN_1_B, the last 50 points. This is the
result:
For all the widgets you can always review the data source, count and refresh rate set-
tings by clicking on the little arrow in top right of the widget and by selecting
Edit
:
You can also move the widget in the screen dragging it by this icon:
Figure 101
Figure 102
Figure 103
Figure 103
7
7