Operating the MM410/AVM-510A
6-23
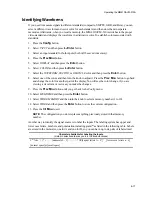
Printing Waveforms and Vectors (AVM-510A)
You can print anything you see in an AVM-510A display except the picture. The picture display is not
processed in the AVM-510A, so it is not available in digital form.
Before you print, you must connect a printer and then configure the AVM-510A for the printer you
want to use. Note that the output to the printer is black and white, even if the waveform is in color.
Connect the printer, using a serial cable, to the AVM-510A’s RS-232 Modem connector at the rear
panel. To configure the AVM-510A for a printer:
1.
Press the
Config
button.
2.
Select OTHER and then press the
Enter
button.
3.
Select SERIAL PORTS and then press the
Enter
button.
4.
Select MODEM/PRINTER PORT using the
Enter
button.
5.
Select PRINTER SETUP using the
Arrow
buttons and then press the
Enter
button.
6.
Select PRINTER TYPE and then press the
Enter
button to select the printer type you have
connected.
7.
Select BAUD RATE and then press the
Enter
button to select the printer’s baud rate.
8.
Select HANDSHAKING and then press the
Enter
button to select XON/XOFF.
9.
To print a waveform, press the
Prev Mnu
button, select MODEM/PRINTER PORT and then
select PRINT SCRN. Afterwards, press the
Blue
(2nd) and
Split Screen
buttons at the same
time.
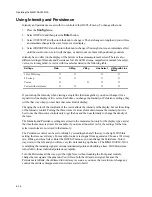
Intensity, Persistence, and Print Density Controls
The Intensity, Persistence, and Print Density controls all affect a printed image. You can use these
controls to emphasize the part of the waveform or vector you want to record.
To see how these controls affect a printed image, think of the video from the AVM-510A consisting of
a fine grid placed over a regular CRT waveform monitor and the brightness of the phosphor is read at
each grid point.
When a point is read, the setting of the Persistence control determines how much the intensity at that
point has decayed since the last time this point was read. The brightness of the display at any point is a
function of how many times the video signal has hit that grid point, plus the previous brightness at that
point, minus the decay set by the Persistance control.
Look at a vector as an example. A normal color bar vector consists of six points plus the center where
the trace spends most of the time and connecting transition lines where the trace spends a much
shorter time. At the normal factory setting of Intensity and Persistence, the dots and the transitions
appear nearly the same so you can see any irregularities in the transitions.
If you turn the Intensity and Persistence to their lowest levels, you will see much fainter transition
lines, but the dots appear clearly.
Содержание MM-410
Страница 16: ...About This Manual 1 4 Notes...
Страница 34: ...Installation 4 6 Notes...
Страница 48: ...Front Panel Operation 5 14 Notes...
Страница 102: ...Viewing Waveforms Vectors and Pictures 7 30 Notes...
Страница 126: ...Automatic Measurement AVM 510A 9 20 Notes...
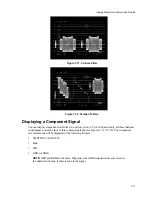
Страница 139: ...AVM 510A Option T For Transmission Monitoring 11 5 Figure 11 3 Differential Gain Figure 11 4 Differential Phase...
Страница 148: ...AVM 510A C For Component Measurements 12 4 Notes...
Страница 158: ...Connector Pinouts B 4 Notes...
Страница 162: ...Calibration D 2 Notes...

