Special methods
35
NANOCOLOR
®
UV
/
VIS
II and
NANOCOLOR
®
VIS
II V 1.1 / 10.2017
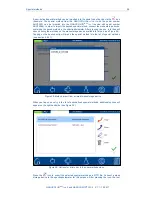
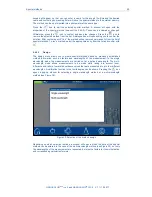
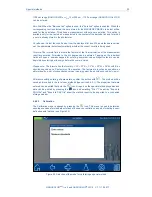
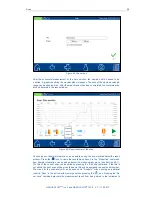
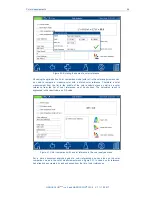
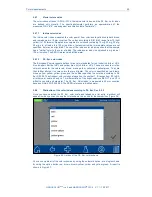
Figure 37: Calibration curve as a result of the measurement of individual standard solutions
For linear and quadratic functions, the confidence interval of the statistical calculation is
shown as hyperbolas in the form of thin blue lines.
(Please note: The factors F0 to F4 are the
photometer factors, not the factors of the compensatory function!)
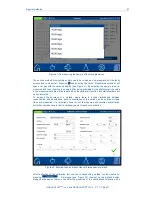
The concentration and
absorbance pairs appear next to the graph and can be included or excluded by selecting or
deselecting the checkbox in front of the pair of values in the analysis. Following the
deselection or selection of data pairs, the calibration function and statistical data will be
recalculated automatically.
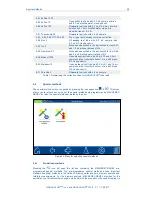
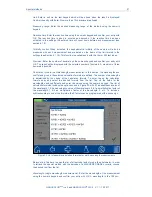
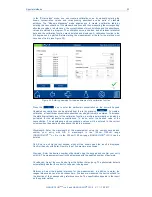
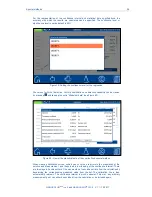
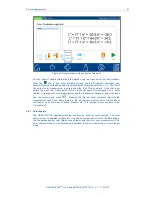
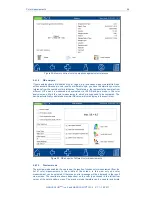
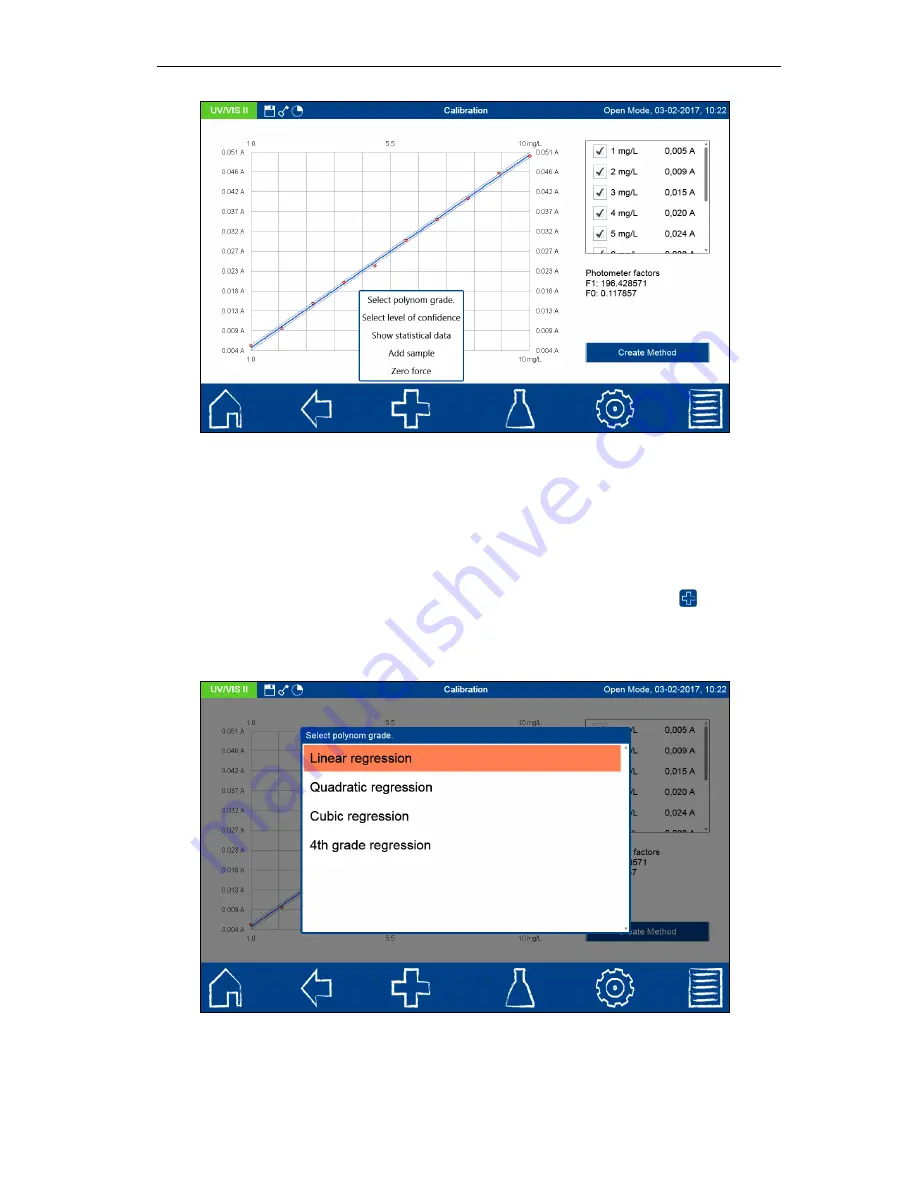
The degree of the polynomial can be changed after the measurement by pressing
and
then tapping the entry
“Select degree of the polynomial.” A list box for selecting the desired
degree of the polynomial will open (see Figure 38). Whenever another polynomial degree is
selected, the calibration function and statistical data will be recalculated automatically.
Figure 38: Setting the degree of the polynomial
Содержание NANOCOLOR UV/VIS II
Страница 1: ......


