IQC
79
NANOCOLOR
®
UV
/
VIS
II and
NANOCOLOR
®
VIS
II V 1.1 / 10.2017
Removing the cuvette or exiting the measurement menu by means of one of the other icons
in the task bar will end the measurement process and save the result in the IQC memory
(see Section 6.6.7) of the device.
6.6.4
Dilution series
Through the analysis of a dilution series, interferences or problems with the sample can be
sought and detected.
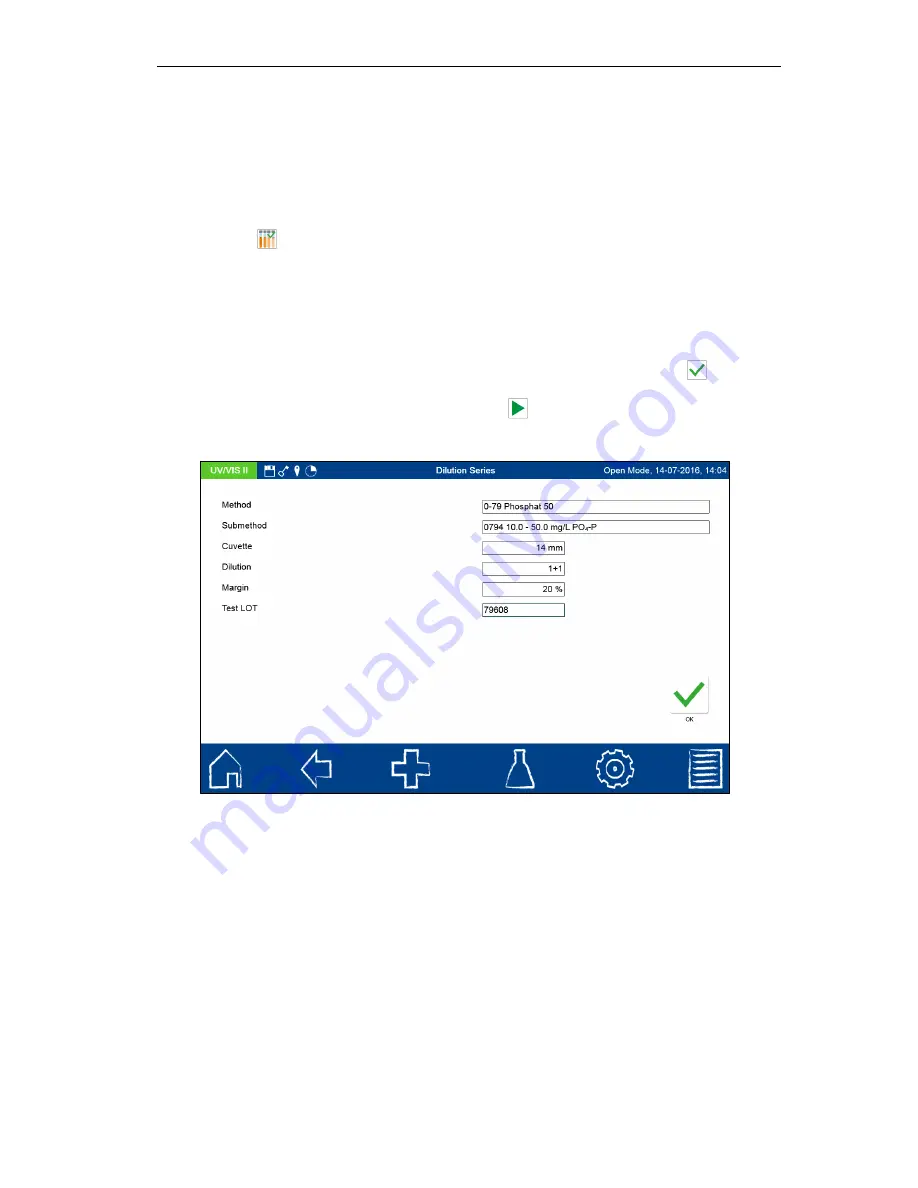
Press the
icon to open the window for specifying the desired dilution series method (see
Figure 96
). Tap the entry “Method” to open the list of methods available on the instrument.
Now you can select the desired method from this list. The submethods can be selected in the
submethod field, if mutiple submethods are available for a method. Specify the dilution factor
for the subsequent calculation by entering the
dilution in the “Dilution” field. Use the
alphanumeric keypad to enter the maximum permissible deviation in percent in the
“Margin”
field. This is calculated as part of the measurement based on the absolute measured value
difference between the expected value and the measured value based on the measured
value. Enter the LOT of the test kit used via the text keypad and then confirm with
to
open the measurement window. After inserting the retrieved sample solutions (
“diluted
sample” and “undiluted sample”) and confirming with
, the measurement will be carried
out and the result will be displayed.
Figure 99: Entering the data for the measurement of a dilution series
After inserting and measuring both sample solutions, the result of the measurement will be
displayed as shown in Figure 100. In the upper right hand corner the result will be rated
“Passed” (green) or “Failed” (red). The measured value is compared against the specified
deviation. In addition to the measurement results, the calculated values for absolute and
relative deviation as well as the expected value for the sample are displayed.
Содержание NANOCOLOR UV/VIS II
Страница 1: ......


