47
4) Frequency of the strain waveform
If vibrations are periodically generated, a frequency can be calculated. Measure the length of 10 or so
cycles, then obtain their average t
2
[mm]. Compare the result with the marker interval, t
c
.
From T
2
, the frequency f is obtained by using the equation below.
5) Analysis of phenomenon
If a phenomenon is so simple that a measurement at a single point is enough, it is possible to disclose
the whole phenomenon by simple calculating the relation between the amount of a strain and a time
from its recorded waveform.
By contrast, a complex phenomenon requires simultaneous or individual measurements at multiple
points. In this case, the relation between the amount of a strain and a time at each point can be also
disclosed using the calculating methods introduced above. However, only this cannot afford thorough
analysis of a complex phenomenon. In addition to analysis on respective measuring points, it is
necessary to compare the results of individual analysis on the time axis.
This analyzing technique should vary widely according to different measuring purposes. There cannot
be one uniform technique.
In many cases, however, it is possible to estimate the relations between measuring points, so consider
these relations together with the measuring results on measuring points, in order to grasp a phenomenon
totally.
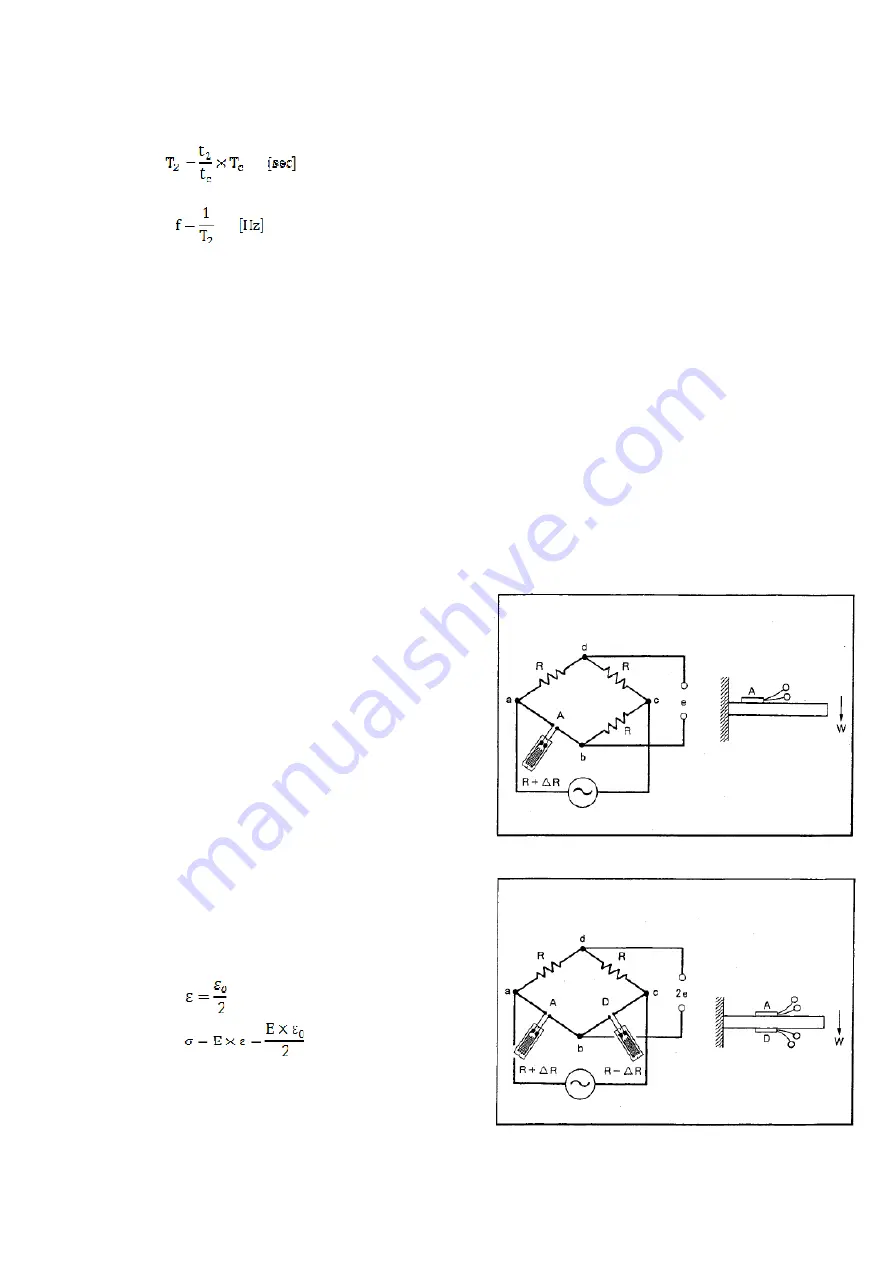
9-3-2 Correction Required due to the Number of Strain Gage Used
The above calculation methods are applicable to a
measurement using one strain gage as an Active gage
*16
as
shown in the right. When using multiple strain gages, the
measuring result should be corrected according to the
number of strain gages in use.
In addition, this correction is not necessary for a strain
gage transducer.
: Strain after correction
0
: Measuring result
: Stress
E : Young’s Modulus (Coefficient of vertical
elasticity)
1) When using both gages to measure strains
(1) When using 2 strain gages in the arrangement
shown in the right, multiply the measurement
value
0
by 1/2.


