


56
The original point cloud, trajectory and GPS files are not modified, but a new sub-folder is added
to the current directory with files that have the same timestamp with the “_loop_closed”
appended to the name.
The gps_20XX-YYY_loop_closed.ply file will contain the points picked for reference when running
the Loop Closure Tool with the specific parameters set by the user.
K E Y P O S E S A N D G E O - L O C A T I N G P O I N T C L O U D S
As we start to look at using GNSS data, we should define two terms.
Geo-location / Geo-reference: This describes a local point cloud that is rotated and translated to
align Survey or Ground Control Points. There is no attempt in this process to morph, rubber sheet,
or in any way to deform the point cloud or trajectory files to align to an external reference.
Geo-register: This describes the process whereby GNSS data is used to align/correct the trajectory
and point cloud files in global space. The process involves realigning the frames from Stencil in
such a way as to align the trajectory with the GNSS coordinates while still maintaining accurate
scan matching between frames. This process changes the point cloud as necessary to match the
global coordinates, thus removing drift throughout the dataset.
If you have survey GNSS data such as Ground Control Points (GCP) but no trajectory or time
estimates, you can still geo-locate your point cloud using CloudCompare, even though you cannot
geo-register your data with the loop closure tool. CloudCompare allows data scaling to fit the
GCPs onto physical features identifiable in the point cloud, but this is not a full rubber-sheeting
approach to warping the point cloud onto the surveyed data.
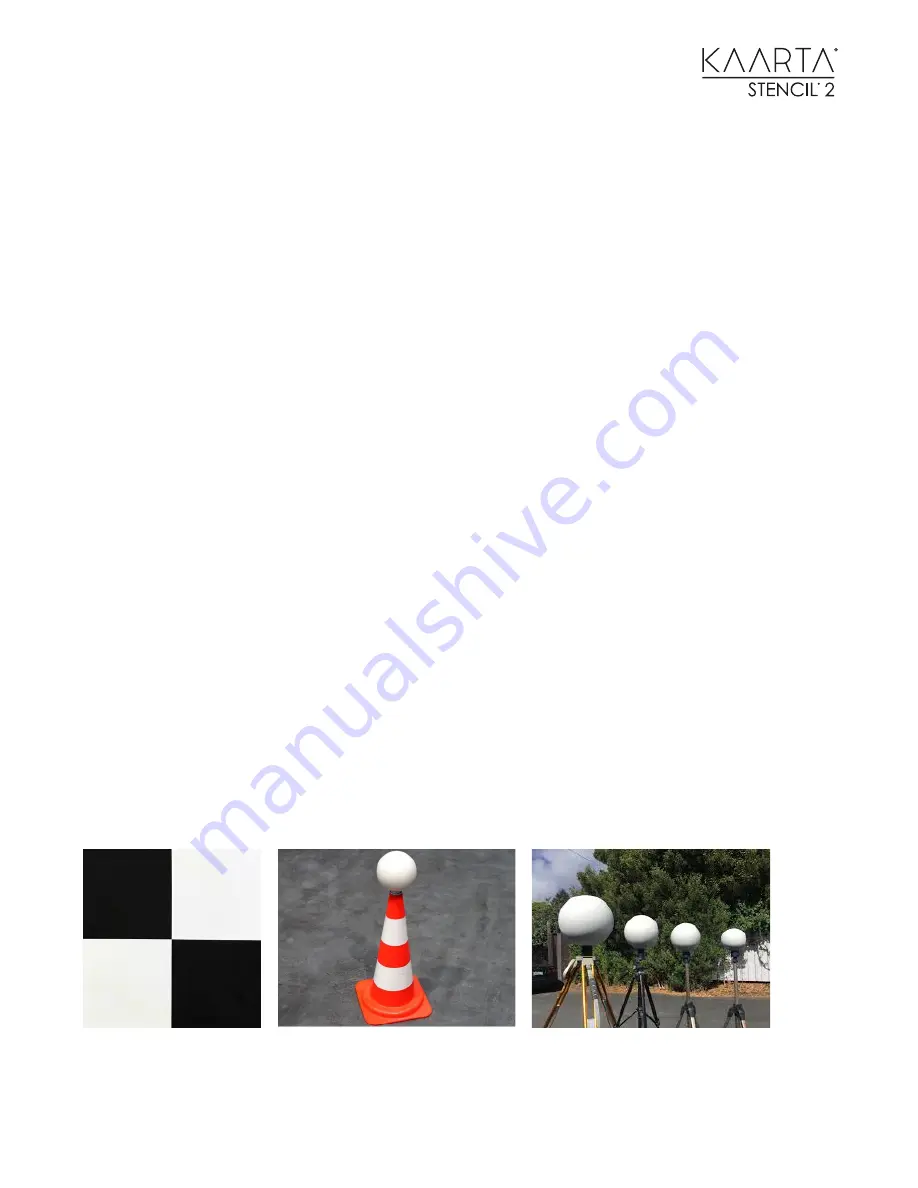
For this method to work, one needs to find the location of the GCPs in the point cloud. This can
either be a physical feature that has been surveyed such as spheres or something that can be
found in the intensity measurements from a reflective target of some type. We have found that
even paper targets from an ink-jet printout of a white/black squares can be seen in the point cloud
by adjusting the intensity saturation values from 0 – 255 to 0 – 45 or 0 – 65
Create a text file with the x, y, z coordinates of each GCP such as this.


