9
Chapter 2
Getting Started
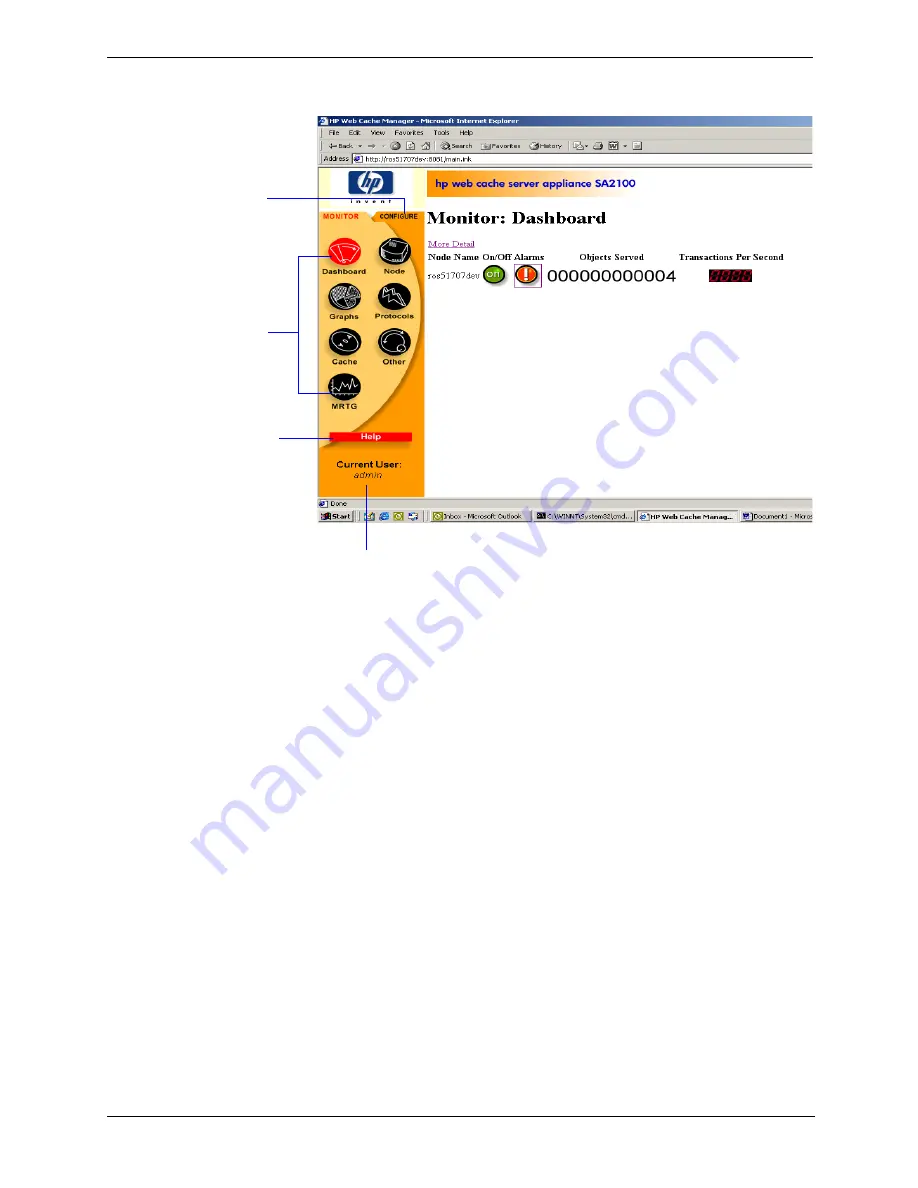
Traffic Manager opens in your web browser and displays the Dashboard, shown in Figure 2-1.
Using the Monitor and Configure tabs
Traffic Manager has two tabs:
•
The Monitor tab lets you view Traffic Server performance and network traffic statistics. For more
information, refer to
Viewing statistics from Traffic Manager‚ on page 63
.
•
The Configure tab lets you view and modify Traffic Server’s configuration options. For more information,
refer to
Appendix 10‚ Configuring Traffic Server
.
By default, Traffic Manager starts by displaying the Monitor tab. To display the Configure tab, click the
Configure tab to the right of the Monitor tab.
Using online help
Both the Monitor and Configure tabs provide a Help button. When you click the Help button, the Traffic
Server online help opens in another browser window. The online help describes each page that opens when
you click a button on the Monitor or Configure tab.
Figure 2-1. Traffic Manager: The Monitor Dashboard
The Monitor
tab contains
seven
buttons.
Click a
button to
display a
page of
Click the
Configure tab
to display the
Configure
buttons and
set
configuration
Click the Help
button to
display a
description of
the current
page
This shows the current
user logged in to Traffic
Manager


