S: Cause/Action
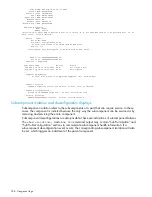
The following alert threshold options are available:
Alert thresholds will cause events at the selected threshold
and below to be shown
2: Informational
3: Warning
5: Critical
7: Fatal
The following event filter options are available:
B: Blade
P: Partition
V: Virtual Partition
U: Unfiltered
Current alert threshold: Alert threshold 2
Current filter option: Unfiltered
Current format option: Extended Keyword
MP:VWR (<cr>,<sp>,+,-,?,H,C,F,I,L,J,D,K,E,R,T,B,P,V,U,/,\,N,2,3,5,7,<Ctrl-b>) >
Location: Enclosure, Device Bay, Socket, Core, Thread AL: Alert Level
Event# Rep Location nPar: AL Encoded Field Data Field Keyword
Ent vPar Timestamp
21 SFW 1,1,0,0,0 255:255 2 43801f4f01e10029 0000000000000000 SET_SECURE_MODE
21 04/24/2012 06:29:23
20 SFW 1,1,0,0,0 255:255 2 4480223a01e10027 0100ff01ffffff94 MEM_DIMM_ENABLE_DONE
20 04/24/2012 06:28:54
19 PDHC 1,2 14:3 2 4480223800e10025 0100ff01ffffff94 DIMM_LOADING_ORDER_DONE
19 04/24/2012 06:28:03
18 OA 1,1 None 2 4480201f00e10023 0100ff01ffffff94 OA_HWMGR_DAEMON_BLADE_POWER_ON_SUCCESS
18 04/24/2012 06:27:51
17 PDHC 1,2 14:3 2 438028d300e10021 0000000000000150 BLADE_DIMM_VOLTAGE
17 04/24/2012 06:27:49
16 OA 1,1 None 2 4480201d00e1001f 0100ff01ffffff94 OA_HWMGR_DAEMON_BLADE_POWER_ON_CONTINUE
16 04/24/2012 06:27:49
15 ILO 1,1 None 2 4b00260300e1001e 010000004f96aa53 OA_REQUESTS_POWER_CHANGE
15 04/24/2012 06:27:47
14 OA 1,1 None 2 4480201a00e1001c 0100ff01ffffff94 OA_HWMGR_DAEMON_BLADE_POWER_ON_WAITING
14 04/24/2012 06:27:47
13 OA 1,1 1 2 448025a900e1001a 0100ff03ffffff94 PARCON_NPAR_RSRC_ACTIVATION_SKIPPED
13 04/24/2012 06:27:45
12 OA 1,1 None 2 44801ff800e10018 0100ff01ffffff94 BLADE_STATUS_DEGRADED
12 04/24/2012 06:26:56
11 ILO 1,1 None 2 4b00260300e10017 010000004f96aa1e OA_REQUESTS_POWER_CHANGE
11 04/24/2012 06:26:54
Health Repository viewer
The Health Repository User Interface displays the information from the HR database. The HR
database contains current state and history covering both service events and the results of error
events analysis.
The following information is available in the HR display:
•
Description of each failure event on the system that results in a service request, even after a
component is removed or replaced.
•
History of component identities installed in the system.
Information in the HR database is stored as installation and action records. These records are
organized with component physical location as the key.
Indictment Records
Indictment refers to a record specifying that a component requires service. The component or a
subcomponent may or may not be deconfigured as a result. Each indictment record contains the
following information:
•
The time of the error.
•
The cause of the error.
•
The subcomponent location of the error (when analysis allows).
In cases when the failing component cannot be identified with certainty, analysis indicts the most
probable component that will need to be replaced to solve the problem.
202 Using event logs
Содержание Compaq Presario,Presario 2816
Страница 107: ...Link 2 OK Link N FAILED IO Slots Status Bay Slot Status 1 1 OK 1 2 OK SHOW IOX STATUS 107 ...
Страница 118: ...Link 7 Unknown Link 8 Unknown 1 18 Interconnect management commands ...
Страница 127: ... Access level Bay level Operator or Admin Restriction You must be connected to the monarch OA ICAPMODIFY 127 ...
Страница 213: ...Xbar Crossbar XFM Xbar Fabric module XML Extensible markup language 213 ...


