background image


EasyScopeIII for DS60M10 User Guide


Version 1.3 


Document Reference No.: CP_000037  Clearance No.: CP#027 

Copyright © Connective Peripherals Pte Ltd 


30 

The menu items have the following functions: 


Illuminate 

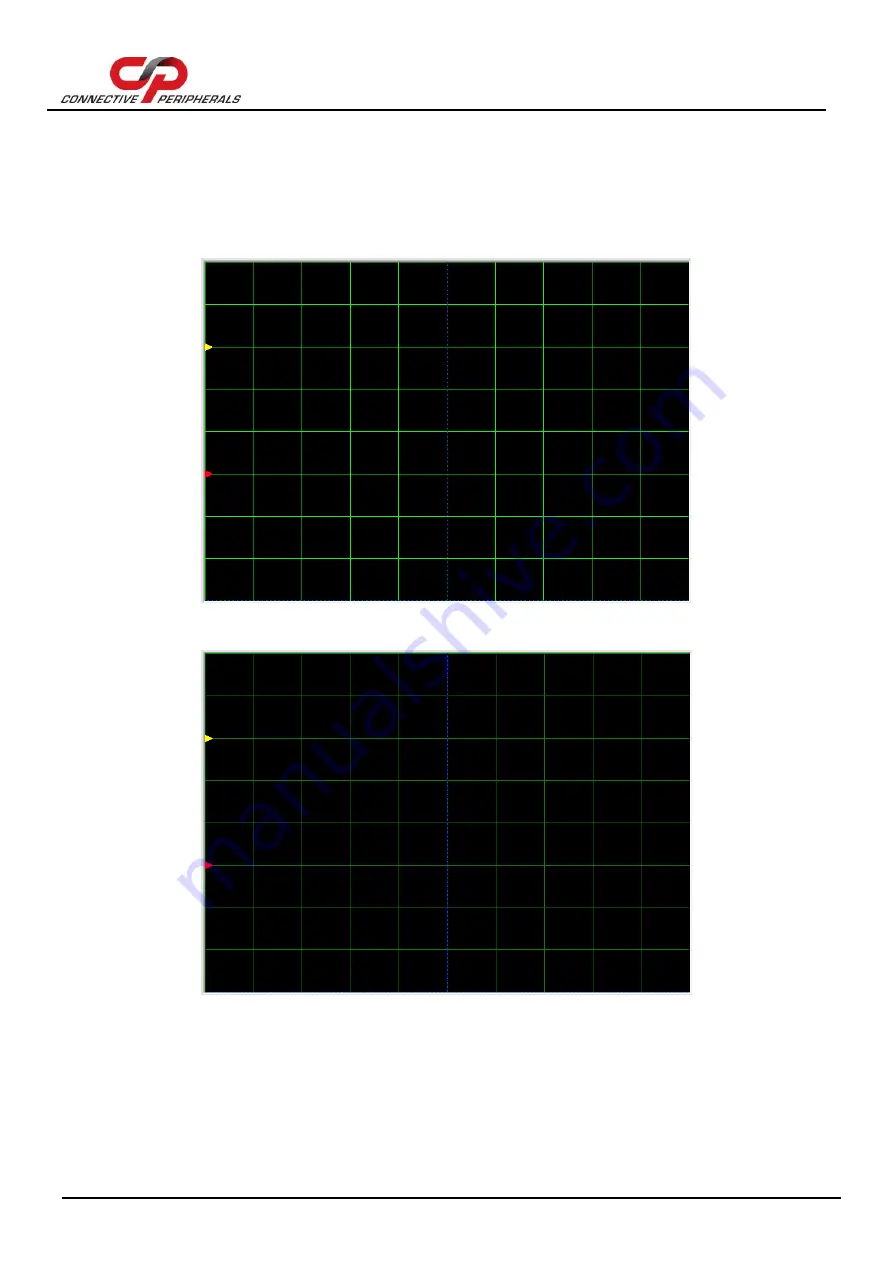
The illuminate option controls the brightness of the grid on the scope display. 
 
With the grid illuminated, it is a bright green colour as shown in the figure below. 


When the grid is not illuminated, it is a dark green. 


When the grid is dim, it is barely visible. 

Содержание EasyScopeIII

Страница 1: ...herals Pte Ltd will not accept any claim for damages howsoever arising as a result of use or failure of this product Your statutory rights are not affected This product or any variant of it is not int...

Страница 2: ...atures 12 3 3 Front Panel Functions 13 3 3 1 Run Stop and Single Buttons 13 3 3 2 Time Base Settings 14 3 3 3 Volts div Settings 15 3 3 4 GND 15 3 3 5 Trigger Settings 17 3 3 6 AC DC Coupling 19 3 3 7...

Страница 3: ...l 38 4 3 4 Channel Enable buttons 39 4 3 5 Slide bar 40 4 3 6 Scale Panel 40 4 4 Toolbar Buttons 40 4 4 1 Open Chart 40 4 4 2 Save Chart 40 4 4 3 Print Chart Area 40 4 4 4 Copy Chart to Clipboard 41 4...

Страница 4: ...o CP_000037 Clearance No CP 027 Copyright Connective Peripherals Pte Ltd 4 4 6 6 Help Menu 55 4 6 7 Mode Menu 55 4 7 Technical Support 56 5 Contact Information 57 Appendix A List of Figures Tables 58...

Страница 5: ...t Reference No CP_000037 Clearance No CP 027 Copyright Connective Peripherals Pte Ltd 5 1 Introduction EasyScopeIII is an easy to use but powerful Digital Sampling Oscilloscope application program for...

Страница 6: ...1 Windows 2 1 1 Installing the software Before connecting the instrument to the PC EasyScopeIII program should be installed The software can be downloaded royalty free from the Connective Peripherals...

Страница 7: ...d conditions will bring to the following screen Figure 4 Setup Wizard Installation Location Select the directory where you wish to install the EasyScopeIII software A default directory is shown on the...

Страница 8: ...that has its own power supply If this is the first time that the instrument has been plugged in Windows will request the USB drivers for your product and will display a Found New Hardware Wizard dial...

Страница 9: ...ocedure should be very similar for other Mac OS versions By default MAC OS may not allow unsigned third party applications to be installed In order to overcome this restriction the security settings n...

Страница 10: ...the Anywhere radio button Upon clicking a confirmation window will be displayed click on Allow From Anywhere Figure 11 Security Privacy Window After the security settings have been changed EasyScopeII...

Страница 11: ...ion 1 3 Document Reference No CP_000037 Clearance No CP 027 Copyright Connective Peripherals Pte Ltd 11 Figure 12 EasyScopeIII app Icon Copy EasyScopelll app to Applications folder to complete the ins...

Страница 12: ...e instrument Figure 14 Oscilloscope Mode GUI 1 Horizontal Slide Bar 2 XY Mode 3 FFT Display 4 Channel Settings 5 AC DC Coupling 6 Adjust Ground Reference 7 Display Trace 8 Invert Data 9 Hardware Indic...

Страница 13: ...data will be displayed on the screen providing that the trigger conditions are met or auto trigger is enabled and the trace display buttons are active The Run button is used to continuously capture an...

Страница 14: ...e Time base Panel There are 20 possible settings ranging from 200 ms division to 100 ns division The knob can be rotated by the left mouse button click and drag or the arrow buttons on the keyboard Fi...

Страница 15: ...o high for the input signal clipping will occur To avoid clipping select a larger voltage scale In addition the settings depend on if the oscilloscope probe used is an x1 1M input impedance or a x10 1...

Страница 16: ...e both the channels are overlapped and Overlapped text is indicated Please refer to the figure below To adjust the ground reference setting use the GND Slider on each channel control panel as shown in...

Страница 17: ...the scope to wait on a trigger event on Channel A defined by the other trigger controls before the display is updated ChB Forces the scope to wait on a trigger event on Channel B defined by the other...

Страница 18: ...ne indicates the trigger point Figure 18 Rising Edge The figure below shows a falling edge The dotted blue line indicates the trigger point Figure 19 Falling Edge Pulse Trigger Pulse from this menu di...

Страница 19: ...Level Slider Use the Trigger Level slider to set the desired trigger level voltage The trigger level is shown as an arrow with a T to the right of the oscilloscope screen and is displayed numerically...

Страница 20: ...the effect of flipping the captured data about the ground reference value for that channel 3 3 8 XY The XY button changes the trace display from a Voltage versus time YT format into a XY format The X...

Страница 21: ...appear as shown in the figure below Figure 21 FFT Window There are two pairs of cursors which may be used to measure differences in frequency To the top of the cursors are the labels ChA C1 ChA C2 for...

Страница 22: ...in the FFT window enables the up down buttons and changes the button caption to Auto This allows the vertical scale of the plot to be changed manually Clicking on Auto will enable auto scaling for th...

Страница 23: ...ctly to an installed printer 3 3 10 6 FFT Window Menu The FFT screen display can be changed to use a number of different windowing algorithms The available windows are displayed when the FFT Window me...

Страница 24: ...ndow is an approach to estimate densities assuming that region is a dimensional hypercube Welch An improvement of the standard periodogram spectrum estimating method it reduces noise in the estimated...

Страница 25: ...hree sets of cursors Cursor X Cursors A and B When the cursor button is clicked Cursors tab becomes active as shown in the figure below To move a particular cursor select the radio button next to the...

Страница 26: ...ure below Figure 22 Oscilloscope Grid The cursor label values are updated in the box below the oscilloscope grid as shown in the figure below 3 3 12 2 Cursor A and Cursor B The Cursor A and Cursor B b...

Страница 27: ...tal cursors can be used to measure the voltage difference between two points of a trace as shown in the figure below The values of the cursor positions are displayed at the bottom of the plot area as...

Страница 28: ...per cycle from the input signal since with the native sampling rate of 60 MHz There is not enough information to draw a smooth waveform The Up Sampling function obtains more information from the samp...

Страница 29: ...e auto set function will terminate 3 4 Menu Functions 3 4 1 File Menu The File menu as shown below allows alternative access to the Run and Stop functions also accessible through the Run Stop button o...

Страница 30: ...erals Pte Ltd 30 The menu items have the following functions Illuminate The illuminate option controls the brightness of the grid on the scope display With the grid illuminated it is a bright green co...

Страница 31: ...g of images takes place for 10 secs for a total of 60 saved screens The images are saved in a new folder created as Autosaved Images in the folder My Documents EasyScopeIII Print Screen Image Sends th...

Страница 32: ...a series of repeated normal events The persistence mode display can be turned On Off using this option The persistence value is 127 and it cannot be configured Save To CSV Text File This option expor...

Страница 33: ...d to acquire real data Math Functions The Math Function menu has three options as shown in the figure below A B This function adds the values of Channels A and B and displays the result waveform as a...

Страница 34: ...econd time Zoom In 25 of the original scale Zoom Out The plot area has the option to be zoomed out twice 3 4 5 Help Menu The following options are available through the Help menu as shown in the figur...

Страница 35: ...2 For XY Mode both Channel A and B should be on This error occurs when only one channel is active when XY mode is selected This error is resolved when both channels are active when XY button is press...

Страница 36: ...ogger Mode To switch between Scope Mode and Data Logger Mode select the Mode Menu Figure 25 Mode Menu Logger Mode 4 1 Overview The data logger has a simple layout with easy to use controls The main co...

Страница 37: ...indows BMP files Export data to CSV file Load saved traces for display Screen printout facility Memo functions to comment data AC DC coupling support Support for x1 and x10 probes User defined display...

Страница 38: ...e plot area which says Stopped Also the disabled controls as stated in Start Button will be re enabled 4 3 3 Sample Interval Use the Sample Interval control to specify the logging rate This must be se...

Страница 39: ...inimum is 0 and X maximum is 1000 thus data logger will accumulate 1000 samples before it will draw the data curve Data logger has a minimum range value to consider 10 samples If the current X scale r...

Страница 40: ...he Open Chart button will display an open dialog box The user can then browse a CSV file csv which can be imported back into the data logger for viewing If there are memo markers accompanying the samp...

Страница 41: ...he chart This will reduce the number of samples to be displayed around the location i e enlarging the area To zoom out click the Zoom Out button and then click on a location on the chart This will inc...

Страница 42: ...cursor is associated with channel A or channel B by selecting the desired channel from the pop up menu shown below The memo cursor has another option to be associated with the memo markers on the plo...

Страница 43: ...and automatically sync to the samples on the curve The x and y coordinates of each active cursor are displayed in the Cursor Panel at the bottom left of the main window The delta column can be made to...

Страница 44: ...o the device will be ignored while running in a test mode 4 4 8 Memo Window Clicking the Memo Window button shows the Memo window This allows markers and information to be added to the chart 4 4 9 Inf...

Страница 45: ...e 28 Memo Window This can be used to manually comment the data on the chart To do this click Marker and click on the chart where the marker is desired This will add the marker to the chart Next type a...

Страница 46: ...s the start date start time sample interval value Also the following channel information is shown Current number of samples Maximum voltage value in mV Minimum voltage value in mV Current number of mi...

Страница 47: ...Y Controls Window The window is divided into three sections Each is described below Y Scale This allows the range of the Y scale to be manually adjusted Simply enter the desired maximum and minimum v...

Страница 48: ...from the main toolbar A save dialog box is shown to allow users to save the current data to a CSV file csv or to a Bitmap file bmp Close The Close option clears the plot area The chart is no longer se...

Страница 49: ...s clicking Channel Enable button for channel A A tick mark is visible if channel A is enabled Channel B Selecting Channel B will enable or disable channel B in the same way as clicking Channel Enable...

Страница 50: ...ged through X Control Window or by clicking on the axis label located on lower right of the plot area Y Scale Selecting Y Scale displays the following sub menu This allows the user to change the Y axi...

Страница 51: ...e as Maximum number of Samples This is only enabled if Custom is selected from the Maximum number of Samples drop down o Backup Data on Exit It indicates if the data on the current run will be saved o...

Страница 52: ...ert is configured for this channel o Type of Alert Type can be Off Email Popup or Both If the type of alert is Off All the alert controls are disabled except for the Alert Number o Greater Less than C...

Страница 53: ...View Menu The View menu allows the user to change the appearance of the data logger Customise Screen Colours Selecting Customise Screen Colours shows the following sub menu Selecting any of the option...

Страница 54: ...ncheck the tracking option This will toggle whether the chart updates constantly to show the newly acquired data or allow the display to remain static If this option is enabled the Slide bar is disabl...

Страница 55: ...load chart becomes selectable from the Window menu If the CSV file is closed using Close option from the File menu the load chart is removed from Window menu and only the data chart is displayed The c...

Страница 56: ...learance No CP 027 Copyright Connective Peripherals Pte Ltd 56 4 7 Technical Support Technical support may be obtained from your nearest Connective Peripherals office See details below E Mail Support...

Страница 57: ...Contact Information Global Headquarters Singapore Connective Peripherals Pte Ltd 178 Paya Lebar Road 07 03 Singapore 409030 Tel 65 67430980 Fax 65 68416071 E Mail Sales sales connectiveperipherals com...

Страница 58: ...screen 10 Figure 11 Security Privacy Window 10 Figure 12 EasyScopeIII app Icon 11 Figure 13 Applications Folder 11 Figure 14 Oscilloscope Mode GUI 12 Figure 15 Time based settings 14 Figure 16 Volts...

Страница 59: ...EasyScopeIII for DS60M10 User Guide Version 1 3 Document Reference No CP_000037 Clearance No CP 027 Copyright Connective Peripherals Pte Ltd 59 List of Tables NA...

Страница 60: ...e Ltd 60 Appendix B Revision History Revision Changes Date 1 1 Initial release 2012 11 19 1 2 Updated release UI Enhancements Unsampling 2014 03 07 1 3 Re branding to reflect the migration of the prod...

Отзывы: