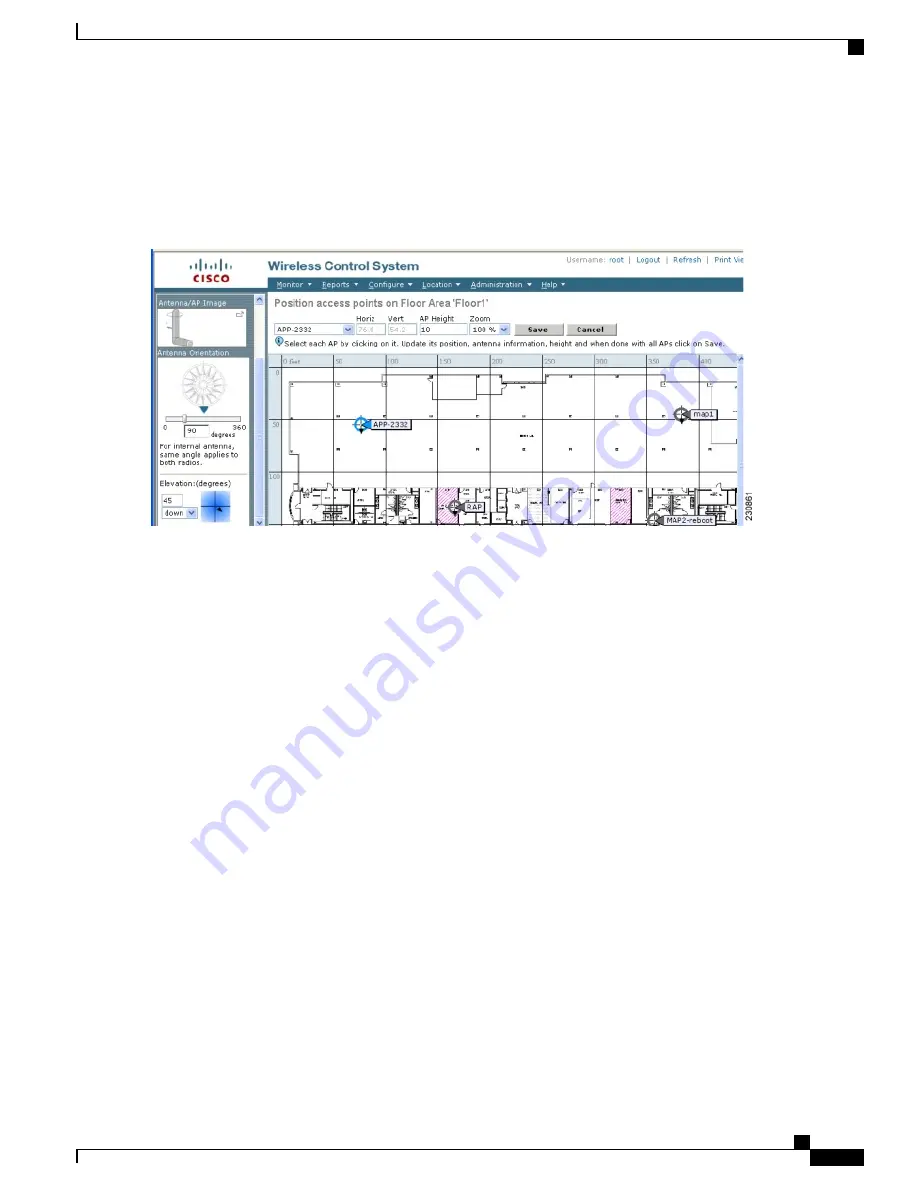
Step 5
Click and drag the icons to indicate their physical locations.
Step 6
Click each icon and choose the antenna orientation in the sidebar.
Figure 91: Antenna Sidebar
The antenna angle is relative to the map’s X axis. Because the origin of the X (horizontal) and Y (vertical) axes is in the
upper left corner of the map, 0 degrees points side A of the mesh access point to the right, 90 degrees points side A down,
180 degrees points side A to the left, and so on. The antenna elevation is used to move the antenna vertically, up or down,
to a maximum of 90 degrees.
Make sure each mesh access point is in the correct location on the map and has the correct antenna orientation. Accurate
mesh access point positioning is critical when you use the maps to find coverage holes and rogue access points.
See this location for further information about the antenna elevation and azimuth patterns:
http://www.cisco.com/en/US/products/hw/wireless/ps469/tsd_products_support_series_home.html
Step 7
Click
Save
to store the mesh access point locations and orientations. Cisco Prime Infrastructure computes the RF prediction
for the coverage area. These RF predictions are popularly known as heat maps because they show the relative intensity
of the RF signals on the coverage area map.
Cisco Mesh Access Points, Design and Deployment Guide, Release 7.3
OL-27593-01
231
Managing Mesh Access Points with Cisco Prime Infrastructure
Adding Mesh Access Points to Maps with Cisco Prime Infrastructure


