


RIM-600 Manual
82
If you double-click on an item in the Environmental or IP Alarm box, all of the listed items will
become selected and/or deselected. Last, select a time frame to perform the query and click
View
.
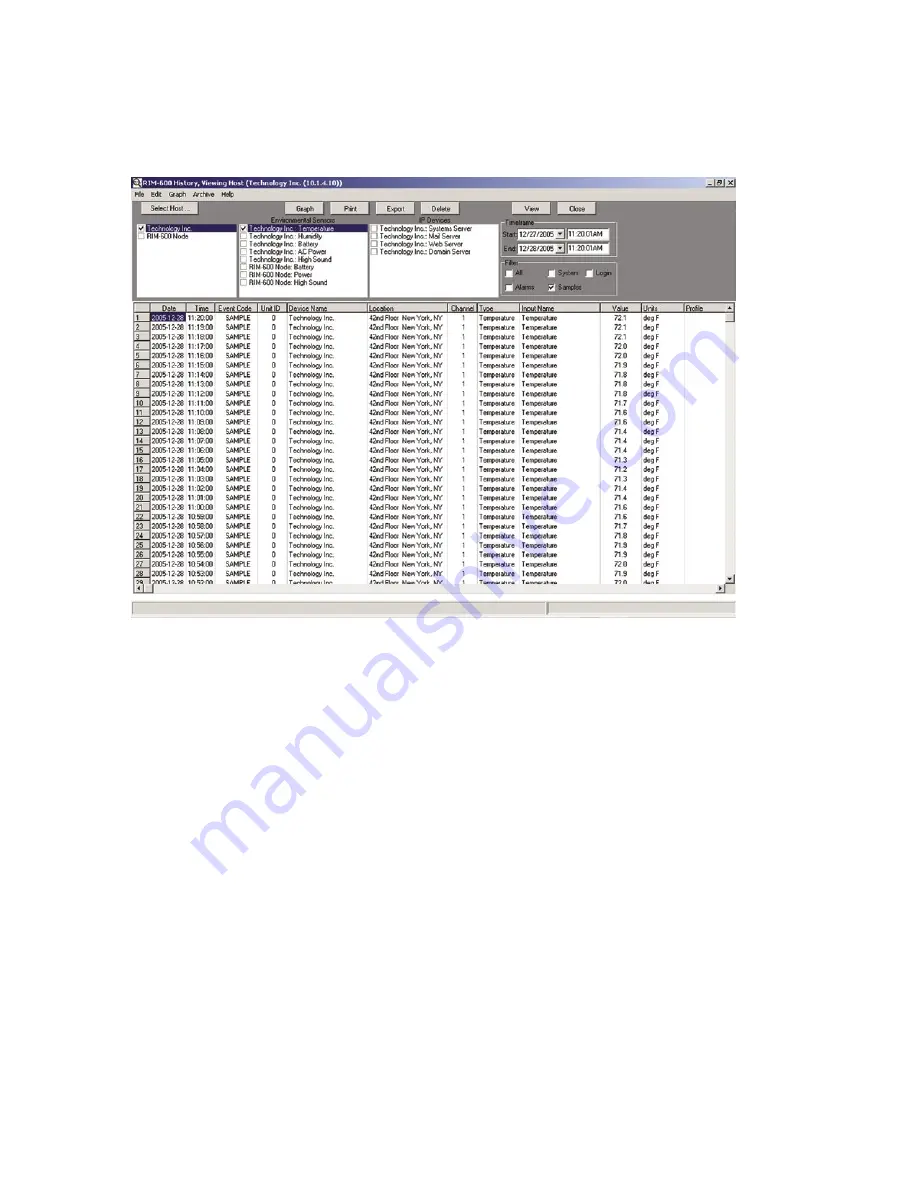
The selected data will now be displayed. See sample screen below:
Figure 56: History Viewer
Graphing
Graphing data is possible when the selected query contains only Samples.
If you click on the
Graph
button, all of the points in the query will be displayed as a line graph.
There are also options (from the
Graph
menu above) to format and display the data as a bar or area
graph. You can have up to eight items displayed on the graph at once. To view different parts of
the graph use the arrows on the bottom and sides to adjust the position. A graph can be printed by
clicking the
button at the top of the screen. You can copy the graph to the Windows clipboard
by clicking the
Copy
button. This allows you to paste the graph into other applications. The
Zoom
In
and
Zoom Out
buttons let you view the data with more or less detail. The
Reset
button restores
the original view of the graph. When finished, click the
Close
button to return to the grid.
Printing Data
You can print the data viewed in the grid by clicking the
button. Printing defaults to an Arial
5 pt. font in order to fit one line of data across one line of an 8.5" x 11" sheet of paper printed in
landscape mode. You may choose different fonts and type sizes.
Exporting Data
The
Export
button allows you to save the queried data in the grid to a file format which can be
easily imported into other applications. Options include the ability to save the file in CSV format,
formatted text (prn), and tab delimited (txt) format. Note: The exported data will represent
only
what you’ve selected to query.
82


