20050401
k
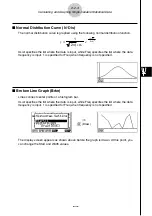
Normal Distribution Curve (N
•
Dis)
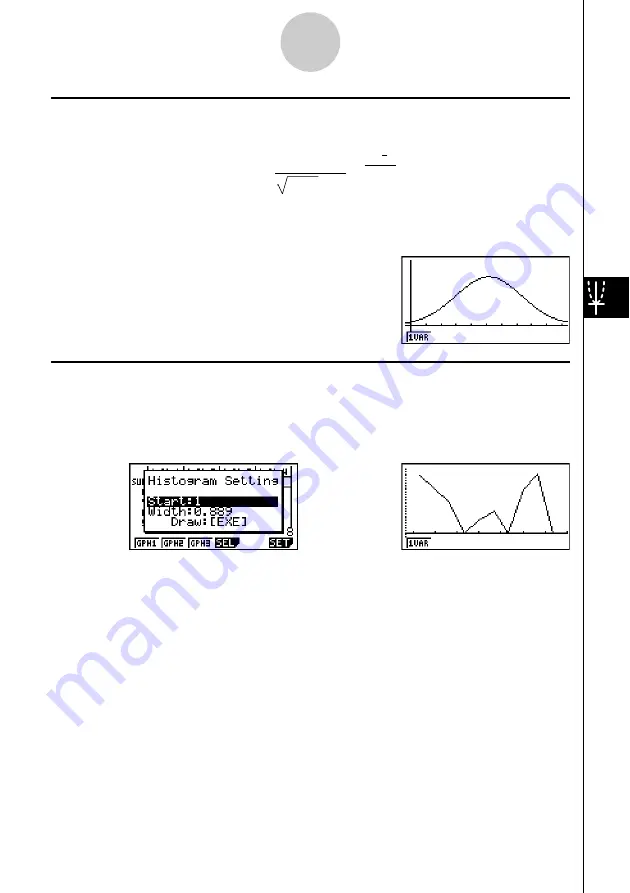
The normal distribution curve is graphed using the following normal distribution function.
y
=
1
(2
π
)
x
σ
n
e
–
2
x
σ
n
2
(
x
–
x
)
2
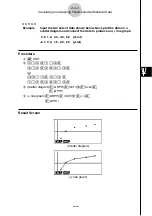
XList specifies the list where the data is input, while Freq specifies the list where the data
frequency is input. 1 is specified for Freq when frequency is not specified.
k
Broken Line Graph (Brkn)
Lines connect center points of a histogram bar.
XList specifies the list where the data is input, while Freq specifies the list where the data
frequency is input. 1 is specified for Freq when frequency is not specified.
6-2-3
Calculating and Graphing Single-Variable Statistical Data
⇒
w
(Draw)
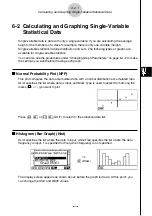
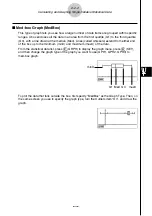
The display screen appears as shown above before the graph is drawn. At this point, you
can change the Start and Width values.
Содержание fx-9860G AU PLUS
Страница 1: ...fx 9860G AU User s Guide E http edu casio com ...
Страница 2: ...Important Please keep your manual and all information handy for future reference ...
Страница 27: ...20050401 1 1 Keys 1 1 1 Keys ...
Страница 335: ...20050401 u u u u u Input Example u u u u u Results 6 5 25 Tests ...
Страница 361: ...20050401 Calculation Result Output Example p F distribution probability 6 7 15 Distribution ...
Страница 435: ...20050401 8 8 2 Program Library egcw w ww w ...
Страница 437: ...20050401 8 8 4 Program Library Example 1 Example 2 fw baw bf w fw baw ca w ...
Страница 439: ...20050401 8 8 6 Program Library wba wb w w d ...
Страница 441: ...20050401 8 8 8 Program Library dw fcde wfcde wfcde fcde w daw w 20070101 ...
Страница 443: ...20050401 8 8 10 Program Library b awaw bwaw aw x d w ...
Страница 590: ...CASIO COMPUTER CO LTD 6 2 Hon machi 1 chome Shibuya ku Tokyo 151 8543 Japan SA0701 E ...

