


P
ag
e
50
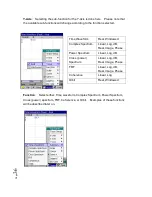
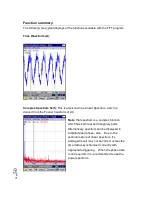
Function summary
:
The following are typical displays of the functions available with the FFT program.
Time Waveform x(t)
:
Complex Spectrum Sx(f):
This is also known as Linear Spectrum, which is
derived from the Fourier transform of x(t)
Note
: that spectrum is a complex function
which has both real and imaginary parts.
Alternatively, spectrum can be displayed in
amplitude and phase, also. Due to the
vectorial nature of linear spectrum, it’s
averaged result may not be correct unless the
time data is synchronized correctly with
appropriate triggering. When the phase data
is not required, it is recommended to use the
power spectrum.
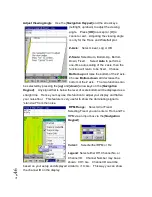
Содержание Fieldpaq
Страница 5: ...Page 4 ...
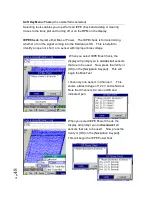
Страница 40: ...Page 39 Legend Select Off Channel No or Channel ID BG Color Select either White or Black background color ...
Страница 54: ...Page 53 Orbit x y ...
Страница 57: ...Page 56 FFT Examples 1 Insertion spike measurements 2 Fieldpaq modal test 3 Sound measurement 4 ...
Страница 61: ...Page 60 ...
Страница 104: ...Page 103 Power Spectrum Time Waveform Bearing Spectrum ...
Страница 199: ...Page 198 ...
Страница 200: ...Page 199 DVF specifications Maximum frequency band Maximum resolution Maximum file size ...
Страница 204: ...Page 203 Done ...
Страница 206: ...Page 205 5 Start the Data Explorer Program 6 Select File Import ...
Страница 215: ...Page 214 ...
Страница 222: ...6 ...


