SmartSwarm 300 Series
:
139
18. APPENDIX 6 – DASHBOARDS
Having enriched our network and added rules and topics to publish the data we are interested in, we now need a
way to display this data. There are several ways to visualize the published data.
●
Use an MQTT client such as
●
Browser extension such as
●
All of these work by subscribing to the MQTT Server and topic.
We can also visualize the published data using dashboards such as
or
Please note that Advantech B+B SmartWorx does not offer Dashboarding software: This section is for example
purposes only.
18.1 NODE-RED
Using Node-RED, a dashboard can be quickly created to display your MQTT data.
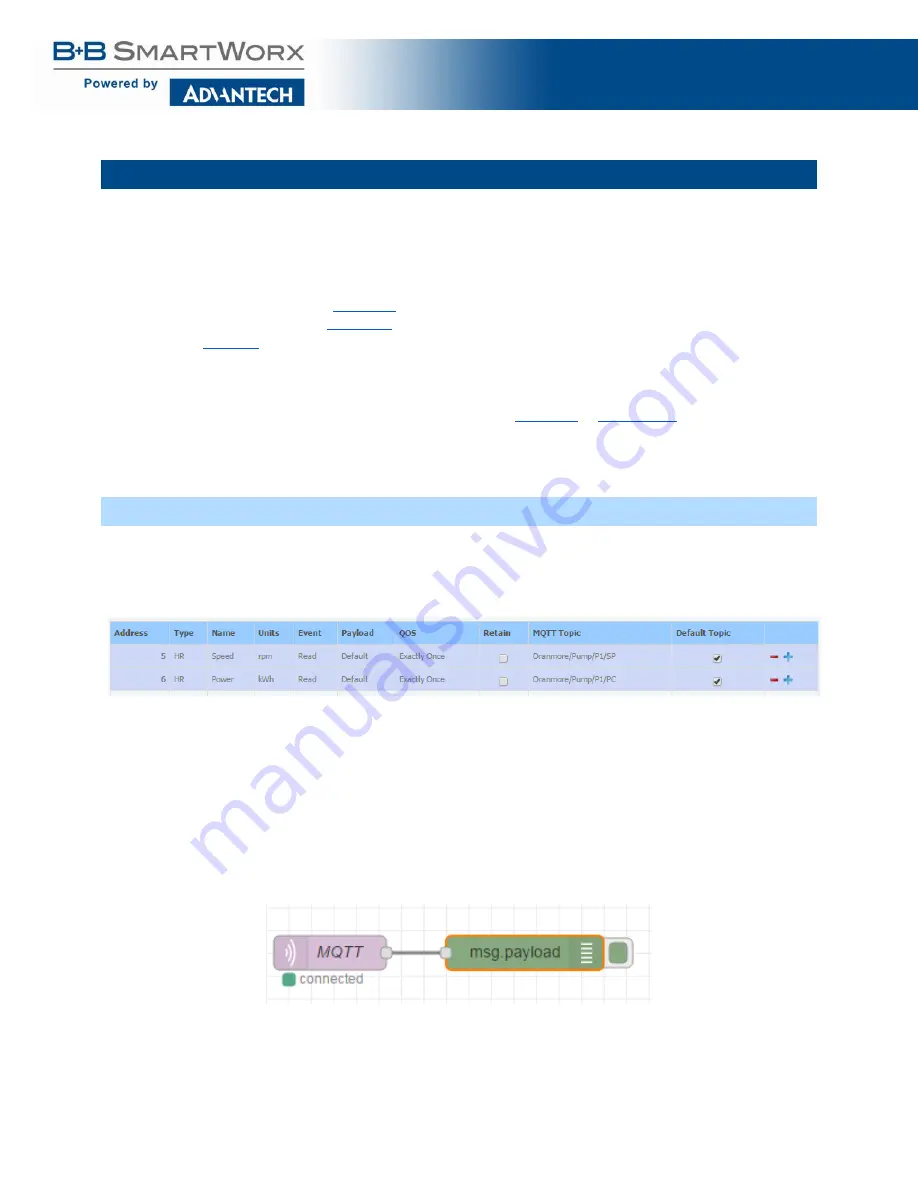
In this example we will set up two rules publishing to two different topics:
This will result in an MQTT payload in the following format
{"id":"Oranmore/Pump/P1/SP","model":{"meta":{"address":{"DEVID":"70000000","P
ORTID":1,"SLAVEID":5,"SWMID":"0"},"description":"Pump","installation_date":"2
9/03/2016","location":"Oranmore","manufacturer":"","name":"P1","product_code"
:"","value_byte_order":"SNo","version":""},"state":{"HR":[{"address":5,"alias
":"","at":"2016-06-
11T21:45:55.183Z","name":"Speed","new_read":true,"new_value":true,"num_value"
:300,"published_on":"READ","state":"VALIDATED","value_from":"RESPONSE"}]}},"t
ype":"ModbusSlave"}
●
Add an MQTT node and a Debug node to the Node-RED flow and connect the 2 nodes
●
Configure the MQTT node by entering the MQTT broker IP Address and the topic we want to subscribe to.
In this example, the topic is Oranmore/Pump/P1.


