Owner’s Guide
41
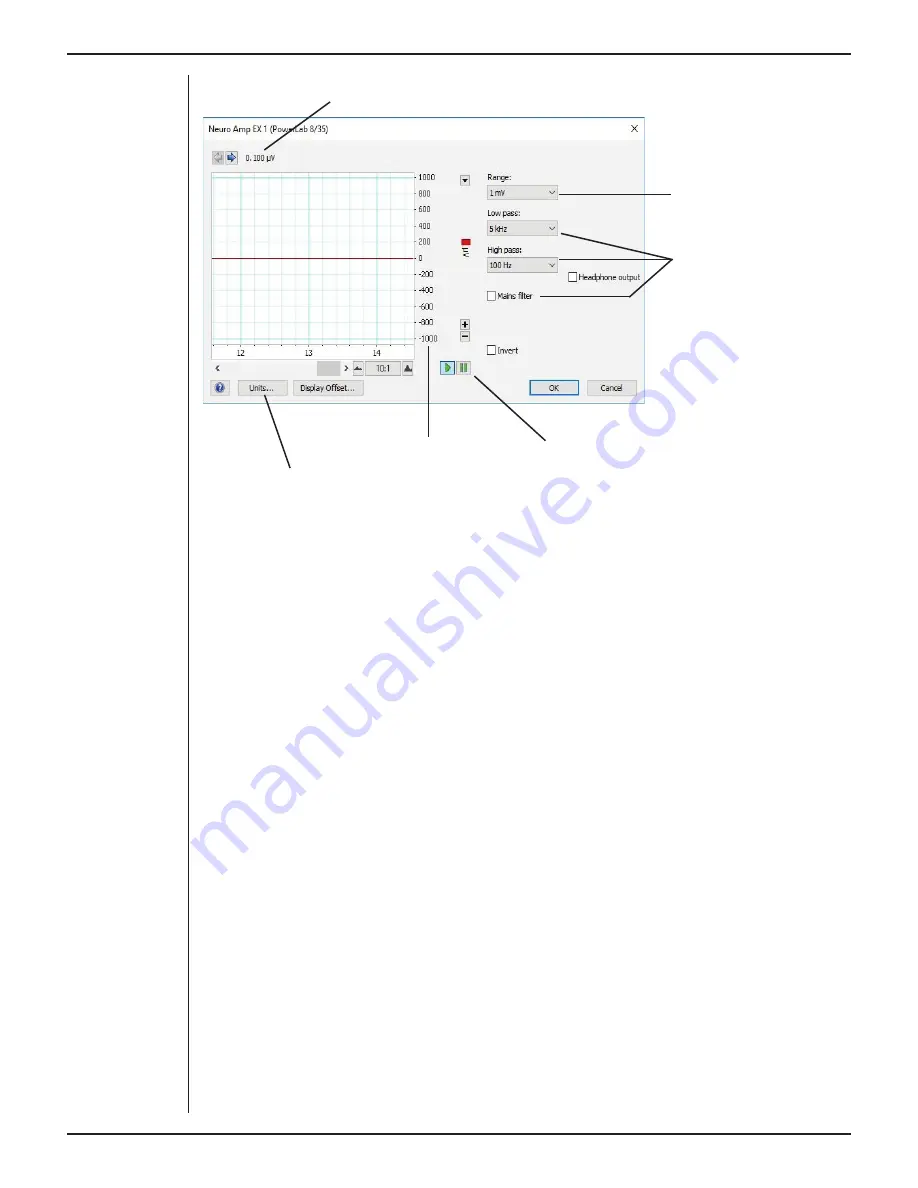
Signal amplitude
Amplitude axis
Pause and Scroll buttons
Click this button to open the Units Conversion dialog
Filtering
options
Range pop-up
menu
Signal Display
The input signal is displayed so you can see the eff ect of changing the settings – no data
is recorded while setting things up. The average signal value is shown above the display
area.
You can shift and stretch the vertical Amplitude axis by clicking and dragging it in
various ways to make the best use of the available display area. It functions the same
as the Amplitude axis of the Chart Window; the controls are identical and any change is
also applied to the Chart Window.
Setting the Range
The Range pop-up menu lets you select the input range or sensitivity of the channel –
the combined range of the PowerLab and the Neuro Amp EX. Changing the range in the
Neuro Amp EX dialog is equivalent to changing it in the LabChart window. The default
setting is 1 mV and the ranges go down to 20 µV in 6 steps.
Filtering
The Neuro Amp EX has low-pass, high-pass and mains filter circuitry that can be adjusted
to suit the application. The mains filter removes mains frequency related interference.
In general, it is better to prevent interference at the source than to filter it. The high-pass
and low-pass filters provide bandwidth limiting of low-frequency and high-frequency
Figure 4–3
The Neuro Amp
EX dialog for
Windows
Содержание BIO
Страница 1: ...Owner s Guide BIO AND NEURO AMPLIFIERS ...
Страница 18: ...Owner s Guide 16 ...


