


3-5
IM CW500-01EN
3.4
Backlight and Contrast Adjustment
Holding down the LCD key for 2 seconds when the backlight is on
displays slide bars for adjusting the backlight brightness and display
contrast. To adjust the brightness or contrast, use the arrow keys to move
the slide bars. After adjusting, press ENTER to confirm. To cancel the
adjustment, press ESC or LCD again.
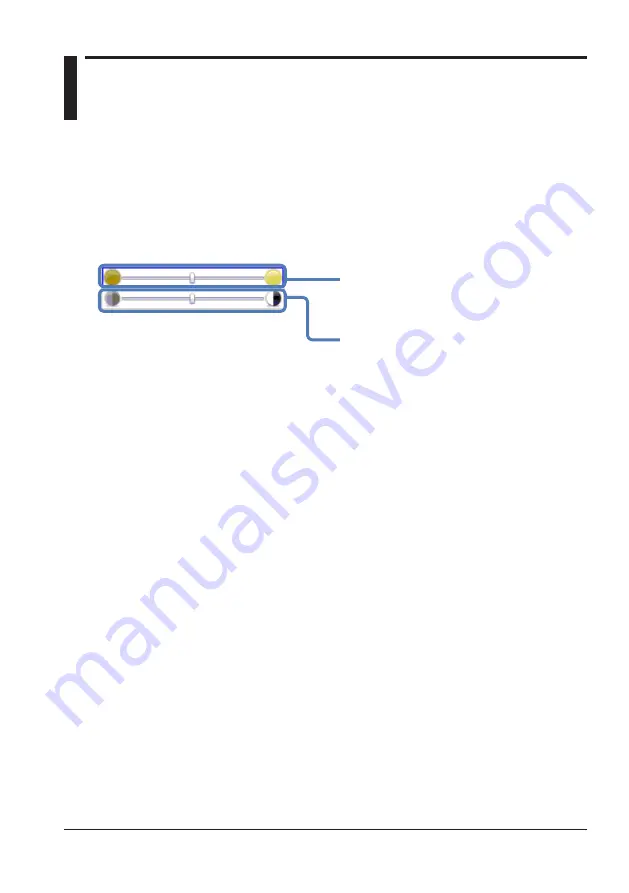
Backlight brightness can be changed
to any of the 11 available levels.
Brightness adjustment
Contrast can be changed
to any of the 11 available levels.
Contrast adjustment


