X - R i t e e X a c t ™ I n s t r u m e n t
74
DIAGNOSTICS TOOL
This tool is used to view errors or view/edit the regional settings of the instrument.
Tap the
Diagnostics
tool icon
on the first main menu screen to access the diagnostics
screen.
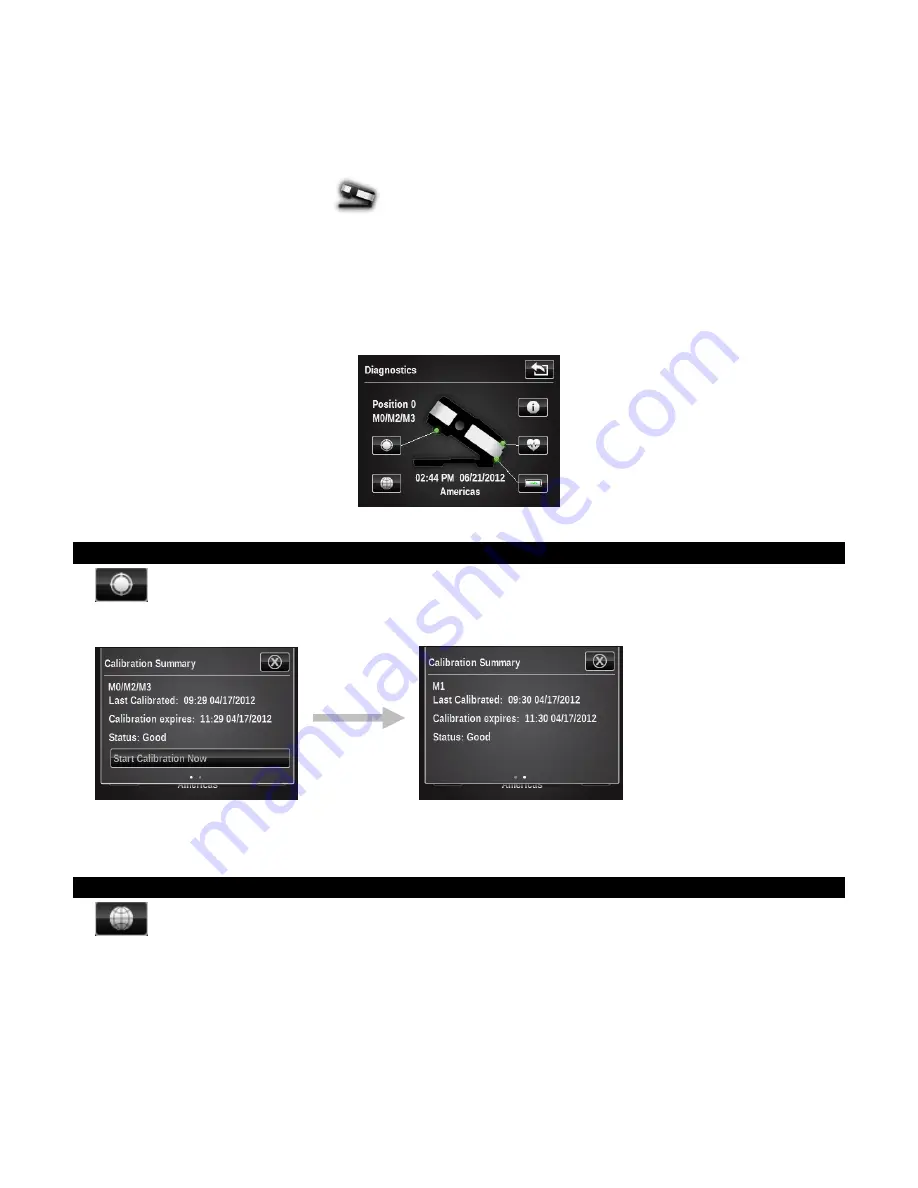
On the diagnostics main screen there are five buttons that provide a profile shot of the
instrument. Each button points to an area of the instrument which will have a colored dot to
indicate the current status of that area of the instrument (some will just have a line as there is no
associated status). Below the instrument image is information displaying the current time and
region setting for the instrument. The screen also lists the current position of the measurement
condition switch.
Calibration Summary
The calibration option displays the calibration status for the current measurement condition. You
can view the other measurement condition calibration status by swiping the screen to the left.
The Calibration button on this screen is used to manually trigger a new calibration, which takes
you to the calibration sequence.
Regional Settings
The instrument maintains a set of configuration settings that exist outside of the user profiles,
which affect the default settings for any new user profiles created. Regional settings are not
unique to different user profiles. Regional settings include the following.
Regional Area: This setting greatly affects all the default settings. (other regional settings, all
color and function defaults, even the initial tools and their configuration in the main menu).
The other settings are set to defaults when the region is changed. However, you can override any
of the following regional settings if you do not like the default configuration.


