Results are populated based on probe responses and beacon frames received on the scanned channels. Refer to
, for
information regarding Active Probe configuration to enable/disable probe requests.
By default a maximum number of 100 SSIDs are displayed on the table. This parameter can be updated to display up to 300
SSIDs; refer to the Setup menu’s
Max AP Discovered
setting (
Entries not active for more than 2 minutes are aged out of the table.
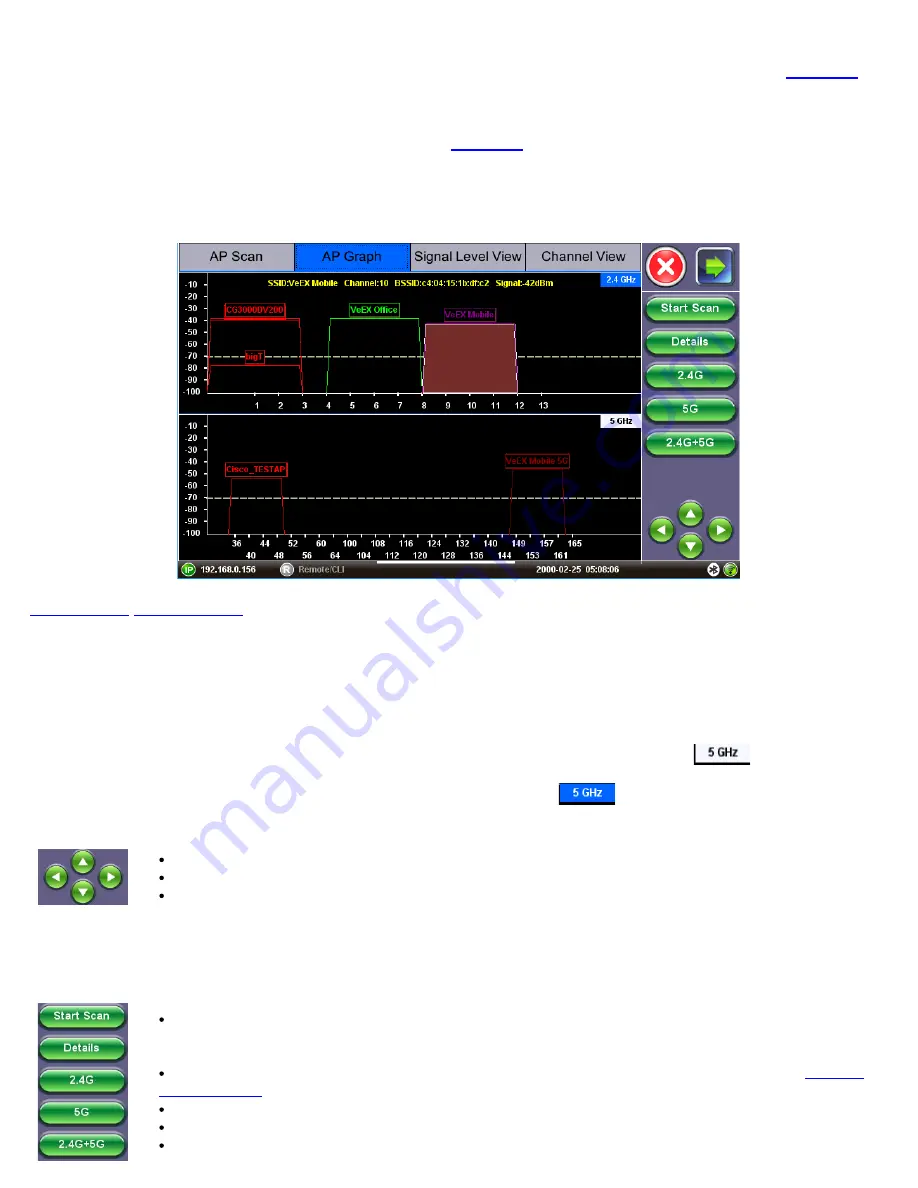
AP Graph displaying 2.4 GHz (top) and 5 GHz (bottom)
7.3.1 AP Graph Navigation
Graph Pane Selection
By default, AP Graph displays both the 2.4 GHz and the 5 GHz frequency bands.
To navigate from the 2.4 GHz graph pane to the 5 GHz graph pane, tap on the corresponding label
.
When the graph pane is selected, the corresponding label is highlighted in blue
.
Graph Pane Navigation
Use the Up and Down arrow keys to scroll through Access Points detected on the same channel.
Use the Left and Right arrow keys to scroll through Access Points on adjacent channels
The AP currently selected is highlighted in red and the SSID is displayed at the top of the graph.
7.3.2 AP Graph Function Keys
The function keys are located on the right hand side of the screen.
Stop
or
Start Scan
: Stops ongoing network scan. The AP Scan table, Graph and Channel View results
are no longer updated. When the scan is stopped, the
Start Scan
button will replace it. Pressing
Start
clears the previous network scan results and starts a new network scan.
Details
: Opens up a pop up window with additional details for the currently selected SSID (see
).
2.4G:
Displays Graph of 2.4 GHz frequency band on full screen.
5G
: Displays Graph of 5 GHz frequency band on full screen.
2.4G+5G
: Displays both 2.4 GHz and 5 GHz frequency band on split screen.
WiFiAirExpertSeries_eManual_D07-00-120P_Rev A00


