Reference Manual
Chapter
4
Ruler E
Ranger Studio
4.4.4
Collection of 3D Data
When you have a suitable exposure time and the ROI have been set, the system is ready
or 3D data generation. The first step is to change to measurement mode as follows:
f
1.
If still running, click
Stop
in the control bar of Ranger Studio main window.
2.
Close the Visualization window.
3.
Choose
Measurement
from Configuration.
4.
Choose
View
Æ
Range
from the menu bar.
A visualization window appears, but it is still empty.
5.
Select the measurement component under the
Measurement
configuration in the
parameter tree in the Parameter Editor.
6.
Click
Start
in Ranger Studio.
The Visualization window shows a grayscale image where a single profile is repeated
from the top to the bottom of the window. You can view the profile in a Profile zoom
window by right-clicking and choosing from the zoom menu if you like.
7.
Move the object back and forth through the laser plane.
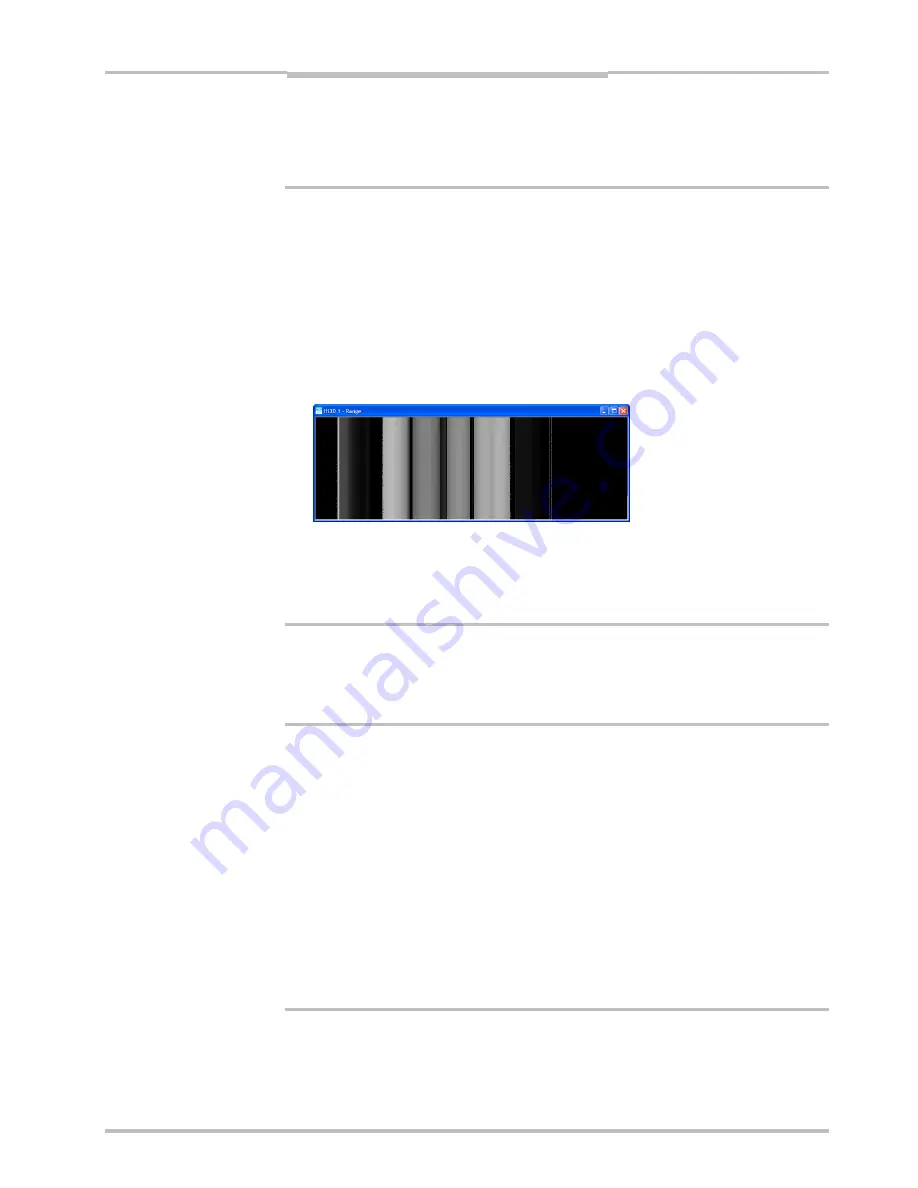
Collection of 3D profiles describing the object’s shape is displayed in the Visualization
window next to the intensity data from the object.
It may be necessary to change parameters to improve the image quality and perform-
ance.
New 3D Profiles are being collected constantly, overwriting what is displayed in the visuali-
zation window. In order to get an entire 3D Image of the object, an external enable signal
will come at handy. A photo switch or similar device can be connected to the Ruler. Infor-
mation on signal requirements and pin configuration can be found in the Hardware De-
cription.
s
8.
Now, we assume a photo switch or similar is connected to the Ruler.
9.
Click
Stop
in Ranger Studio.
10.
Select the
Measurement
configuration in the parameter tree.
11.
Select the
Use Enable
parameter and change the value to 1.
This means that measurements will be generated only as long as the photo switch is
active.
12.
Click
Start
in Ranger Studio to start the Ruler again and keep the switch active as long
as the object is in the laser plane.
13.
Move the object thru the laser plane at a constant speed.
Now a 3D image (i.e. collection of 3D profiles) is displayed in the Visualization window.
If the whole object does not fit into one image, try to increase the object speed.
14.
If you want to save the configuration from the Ruler, click
Stop
to stop the acquisition.
15.
Click
Save parameters
and give the file a name.
1
6.
Click
Disconnect
.
SICK IVP • Industrial Sensors • www.sickivp.com • All rights reserved
37


