Reference Manual
Chapter
4
Ruler E
Ranger Studio
4.2.1
Zoom in Visualization Windows
The zoom function is available in any visualization window. Right-click in the visualization
window to display the zoom menu:
$
New 8-bit gray-scale zoom window
$
New 3D zoom window
$
New profile zoom window
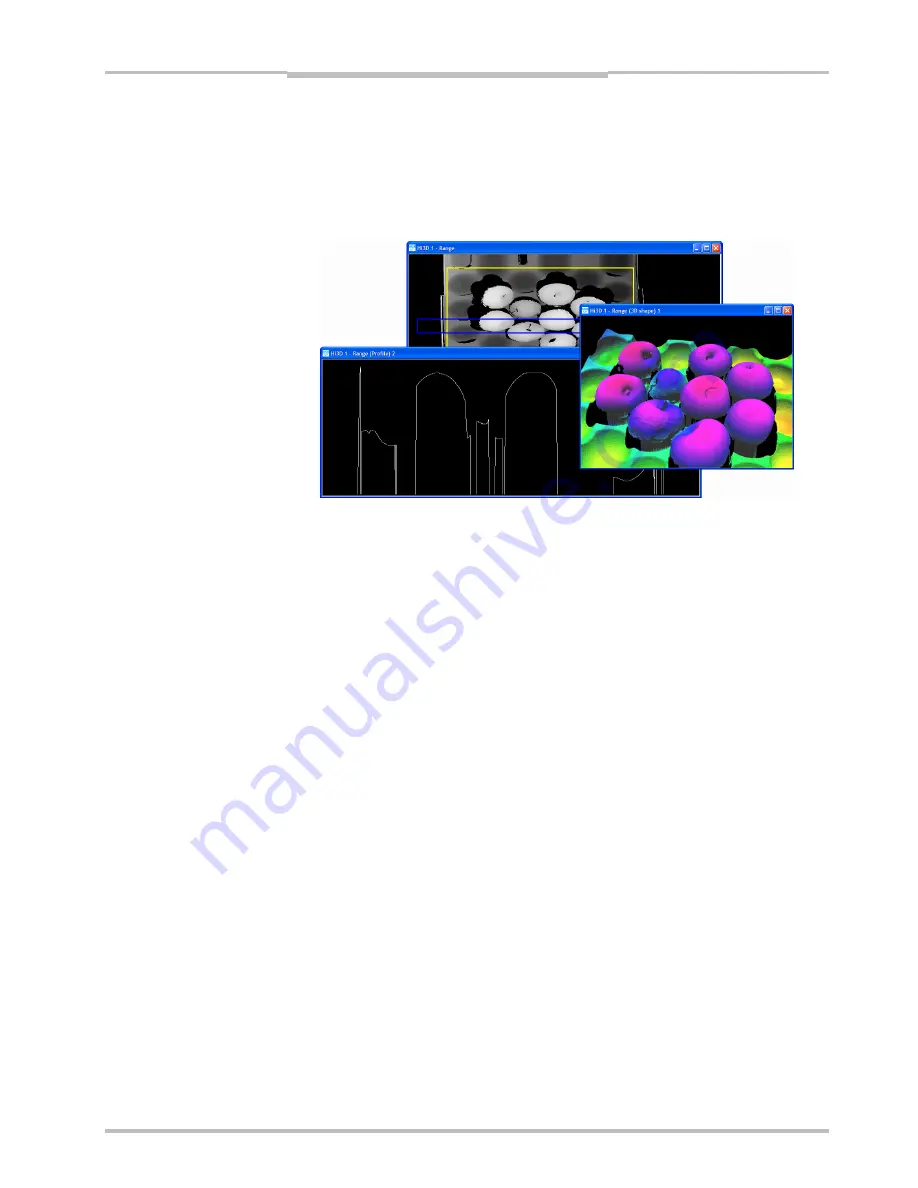
Figure 4.5 – Range visualization window with Profile and 3D zoom windows.
When choosing a zoom window from this menu a rectangle is shown at the upper left
corner of the active visualization window and a new zoom window is opened. Several zoom
windows can be shown simultaneously.
To separate which rectangle belongs to which zoom window, the rectangles have different
colors depending on the type of zoom window:
8-bit grayscale
Green rectangle. The region is displayed as a grayscale 2D image.
If you resize the zoom window, you may have to move or resize the
rectangle in the visualization window before the zoom is displayed in
full resolution.
3D zoom
Yellow rectangle. The data is displayed as a 3D surface, where varia-
tion in height is also indicated by different colors. The lowest value is
shown as black color.
Before generating the 3D surface, the data is filtered by a small
median filter to reduce noise peaks. The 3D zoom window can be of
use even if the data is intensity data.
Profile zoom
Blue rectangle. The region is shown as a rectangle, but the profile
displayed is taken from the top row of the rectangle. The data is dis-
played as a profile, where range, intensity or scatter is displayed as
the y-coordinate.
Note that the profile window shows 8-bit data, which means that the
measurement values are translated to 256 levels, just as in the visu-
alization windows.
The contents of the zoom image are updated as the rectangle is resized and moved
around in the active visualization window. The rectangle is resized and moved by pressing
the left mouse button pointing the cursor on the frame or in the middle of the rectangle
respectively.
When viewing the 3D zoom, you can change the perspective and coloring of the 3D sur-
face:
$
Hold down the left mouse button and move it to change the viewing direction, so that
the object can be viewed from various angles.
$
Hold down the right mouse button and move it up or down in the image to remap the
coloring of the surface. This can be used to emphasize different parts of the current
data.
SICK IVP • Industrial Sensors • www.sickivp.com • All rights reserved
33


