3 Using the system
│
35
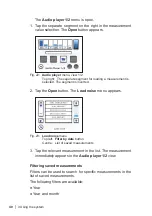
Fig. 20:
Audio player 2/2
menu
Top:
Measurement value selection
Below: Information about the selected measurement
including frequency graph
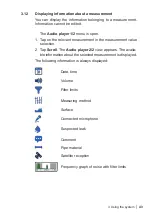
Measurement value selection
Fig. 21: Measurement value selection in
Audio player 1/2
Left:
7 connected segments
for up to 7 recorded measurements
Right: 1 separate segment for 1 saved measurement
The measurement value selection represents measurements by
their measurement value (numeric value and bar).
The measurement value selection is divided into the following
two areas:
●
7 connected segments for up to 7 recorded measurements
−
The current measurement is displayed on the left. The oldest
measurement is shown on the right.
−
If fewer than 7 measurements have been recorded, the emp-
ty segments are grey.
−
The display of the selected measurement is inverted.
●
1 separate segment for loading and playing back a saved
measurement
−
The saved measurement is displayed after it has been loaded.


