3 Using the system
│
27
To set the volume, tap either on the symbols or the area in
between the symbols.
3. Apply the settings by pressing
Confirm
. The receiver will
switch back to the main view.
The settings are stored until they are next adjusted.
3.6
Adjusting the filter settings
3.6.1
Notes on the filter settings
The receiver analyses the frequencies of the noise. This frequen
-
cy analysis is displayed in a graph.
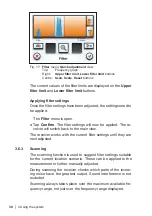
Fig. 15:
Frequency graph
1 Frequency axis, 2 Lower stopband,
3 Lower filter limit, 4 Graph of frequency analysis,
5 Passband, 6 Upper filter limit, 7 Top stopband
3.6.1.1 Filter limits and stopband
The two filter limits determine the position and width of the stop
-
band within the frequency range. The passband always has a
minimum width. The minimum width depends on the frequency
range.
Frequency range Minimum width of passband
0 – 5 kHz
300 Hz
5 – 12 kHz
500 Hz


