44
6-2. Presented value (PV) graph view
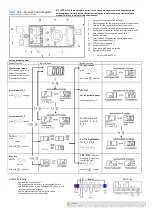
● It is a screen to display the data recorded in [3-1(5) Stationary operation 3 operation screen] and [3-2(5) Program operation 3 operation screen].
● The function of , is not operated in case of 1 page for recorded data.
● The searching scroll bar is not displayed in case of smaller recorded data.
● The date and time saved into the memory are displayed out the screen. [Reference 1]
[Fig. 6-5] Graph&Save setting screen 2 (Graph display is selected)
3
2
4
9
6
5
1
7
8
Purple at base line temperature (Set Data, Indicated Data) and humidity
(Set Data, Indicated Data) is displayed.
●
When the checked is touched, it is disappeared on the graph
screen and when is touched, it is displayed on the graph screen.
●
Refer to [Fig. 6-5 and Fig. 6-6 Graph & Save setting screen 2]
Display to update the graph screen immediately which is being saved.
Moving from current screen to next screen
Base line to disply the data checkpoint
●
Using the touch screen and No.8 Button to move to the point where
we want.
The time axis is expanded or reduced.
Moving to the beginning and end of the displayed PV graph page
Moving of graph screen by one page.
Moving the purple line on the graph screen up/down by 1 DOT
●
When the screen is touched, the indicated values are
displayed while the purple line moves.
When the blue part on the bottom of the screen is touched, it moves
to the corresponding page on the touched point of X coordinate.
①
②
③
⑥
⑤
④
[Reference1]
⑦
⑧
⑨
References
▶
: Icon to display of no card insertion or no recognition
▶
: Icon to display the SD card capacity (usage is less than 75%)
▶
: Icon to display the SD card capacity (usage is 75~90%)
▶
: Icon to display the SD card capacity (usage is more than 90%)
Summary of Contents for TEMI1000 Series
Page 1: ......
Page 10: ...Part 02 Main screen 9...
Page 37: ...Part 05 Appointed operation setting 36...
Page 75: ...Part 09 Communication error 74...
Page 78: ...MEMO...
Page 79: ......
Page 80: ......


