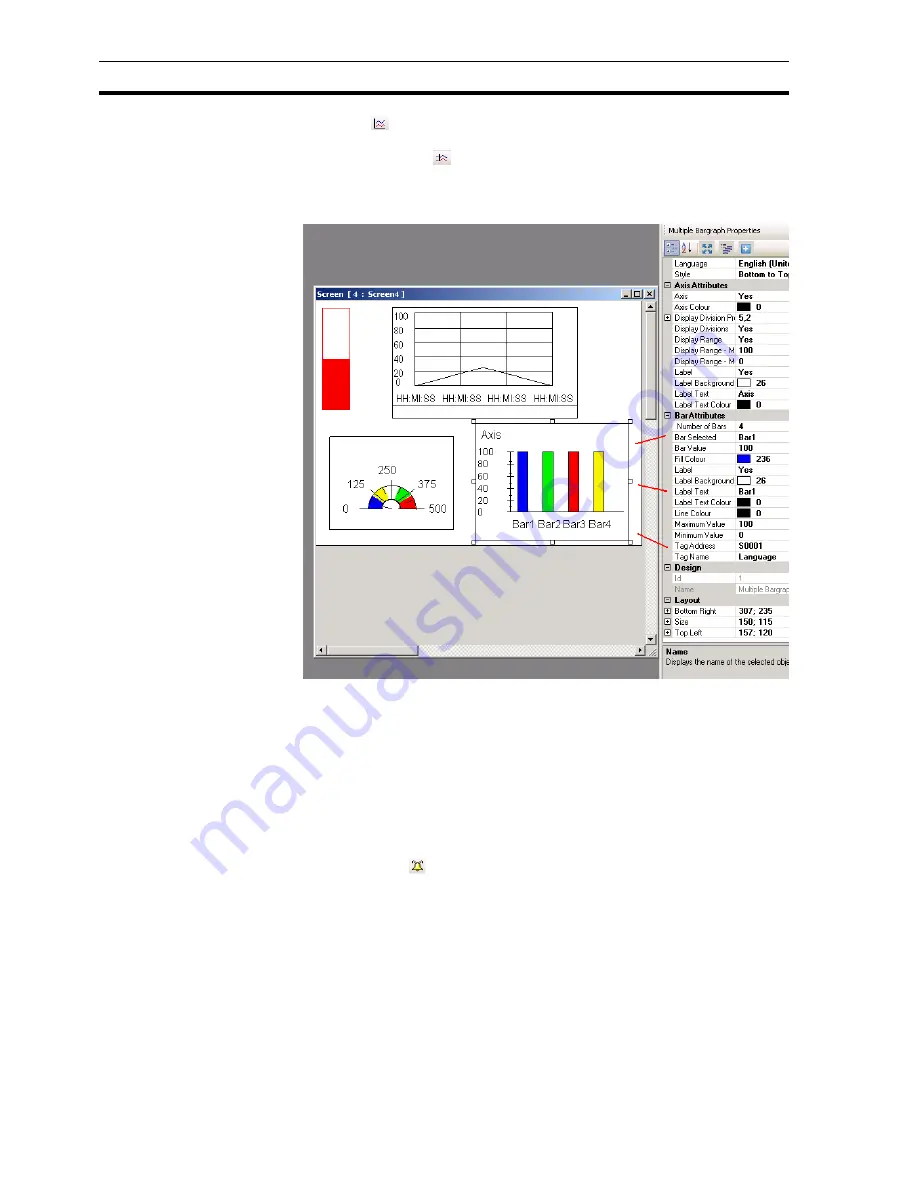
Example application
Section 4-3
46
• Trend (
)
To display a value over a period of time in a diagram.
• Historical Trend (
)
To display the trend of logged data. This command can only be used if a
tag is logged in data logging. A maximum of 4 logged tags can be shown in
the historical trend.
Figure 4.22: Wizards
4-3-10 Alarms
Alarm windows are created for displaying alarms on screen. The most
important properties for alarms are as follows:
• Alarm Type (real time or historical)
• Select Display Fields ( what is shown and order)
Proceed as follows:
1 Click
Screen
.
2 Click
Alarm
(
).
To define the alarm see Alarms in 4-2-2-4 Project panel.
3 Click
Collection
from
Select Display Fields
in the property panel.
4 Select
On-Time and Off-time
and click
Add
. The order of data shown in
the window can be configured here.
Summary of Contents for NQ HMI
Page 1: ...NQ Series HMI GETTING STARTED GUIDE Cat No V07 EN 01 NQ3 TQ0 B NQ3 MQ0 B NQ5 SQ0 B NQ5 MQ0 B...
Page 2: ......
Page 6: ......
Page 14: ...Conformance to EC Directives Section 1 7 xiii...
Page 20: ...Specifications per model Section 2 4 6...
Page 78: ...Debugging Section 6 2 64...
Page 88: ...NQ Series diagnostics Section 7 4 74...
Page 144: ...130...


