117
HIGH OXYGEN ACCUMULATION
The O2 Bar Graph displays either oxygen accumulated during
that nitrox dive, or during the repetitive nitrox dives you conduct
during that 24 hour period, whichever of the two is greater at
that time. The O2 Bar Graph allows you to monitor how close
you are coming to the limits of oxygen exposure.
If the theoretical amount of oxygen accumulated equals, or
exceeds, the limit for a single exposure, or the exposure limit for
a 24 hour period (300 OTU), Oxygen Dive Time Remaining
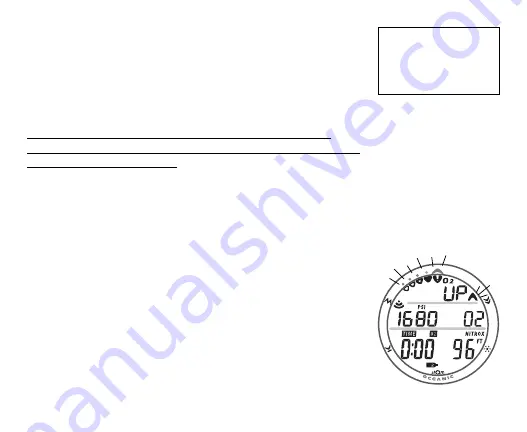
becomes 0:00 (hr:min), the graphic O2 appears and the full O2
Bar Graph and UP Arrow will be displayed flashing (Fig. 105).
The red LED warning will flash, the Audible Alarm will sound,
and the message HIGH > O2 will scroll at the top of the display.
When the Alarm is acknowledged/silenced, the message UP >
HIGH > O2 will scroll until the level of oxygen decreases below
the limit.
Press the A button to view the Alternate and Secondary
Displays.
The unit will revert to the MAIN Display after 3 seconds.
Upon surfacing, operation will lock in to NORM Mode until the
O2BG recedes to4 segments. Access to Watch Mode is al-
lowed but access to GAUG and FREE is blocked.
Fig. 105 - HIGH O2
Refer to page 167 for
a Chart of NOAA
Oxygen Exposure
Limits.


