11 Testing with Zodiac Quick Check - PC-based
81
MADSEN Zodiac
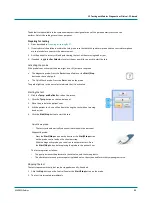
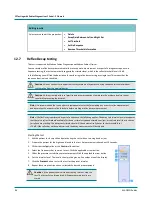
The detected reflex is shown in the results area.
•
Stimulus type level
•
Deflection curves
If a reflex is not detected, then the curve of the loudest stimulus is displayed together with a No Response indication.
C. Reflex Screening results
The results table shows the results related to the currently selected curve:
•
Probe
(the probe tone in Hz)
•
TPP
(Tympanometric Peak Pressure)
•
ECV
(Equivalent Ear Canal Volume
•
SA
(Static Admittance), or
SC
(Static Compliance) when volume equivalent units are used
•
TW/Ratio
(Tympanometric Width/Tympanometric Ratio). Describes the steepness of the curve.
•
Type
(Jerger types A, As, Ad, B, C, D and E denote the shape of the 226 Hz curve). You can set the type to be
determined automatically, and you can subsequently change it manually, if necessary.
D: Tympanometry results
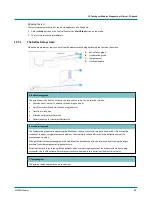
The graph area shows the tympanometric curves and can rescale automatically to fit the curves.
•
Tympanometric curves
•
Pressure and admittance scales
•
Ear canal volume bar
•
Norm area
The ear canal volume is shown to the right of the graph.
B. Tympanometry graph


