12 Testing with Zodiac Diagnostic or Clinical - PC-based
101
MADSEN Zodiac
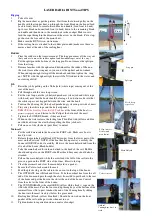
The on-line values show the current settings and status.
•
Probe tone in Hz
•
Stimulus side
•
Current pressure and admittance scales
A. On-line values
•
Timeline in seconds
•
The recorded admittance graph shown in the left graph area
B. Admittance Recorder graph
•
The live baseline graph shown in the right graph area
C. Live baseline graph
The results table shows the results related to the currently selected curve:
•
Stimulus side
•
Duration in seconds
D. Admittance Recorder results table
•
The primary tympanogram is shown in this view.
E. Tympanogram
A.
On-line values
B.
Admittance Recorder
graph
C.
Live baseline graph
D.
Results table
E.
Tympanogram
F.
On-screen selections
The Admittance Recording
screen showing recorded
admittance changes.


