MI 2130 VoltScanner
Downloading and Analysing Data
24
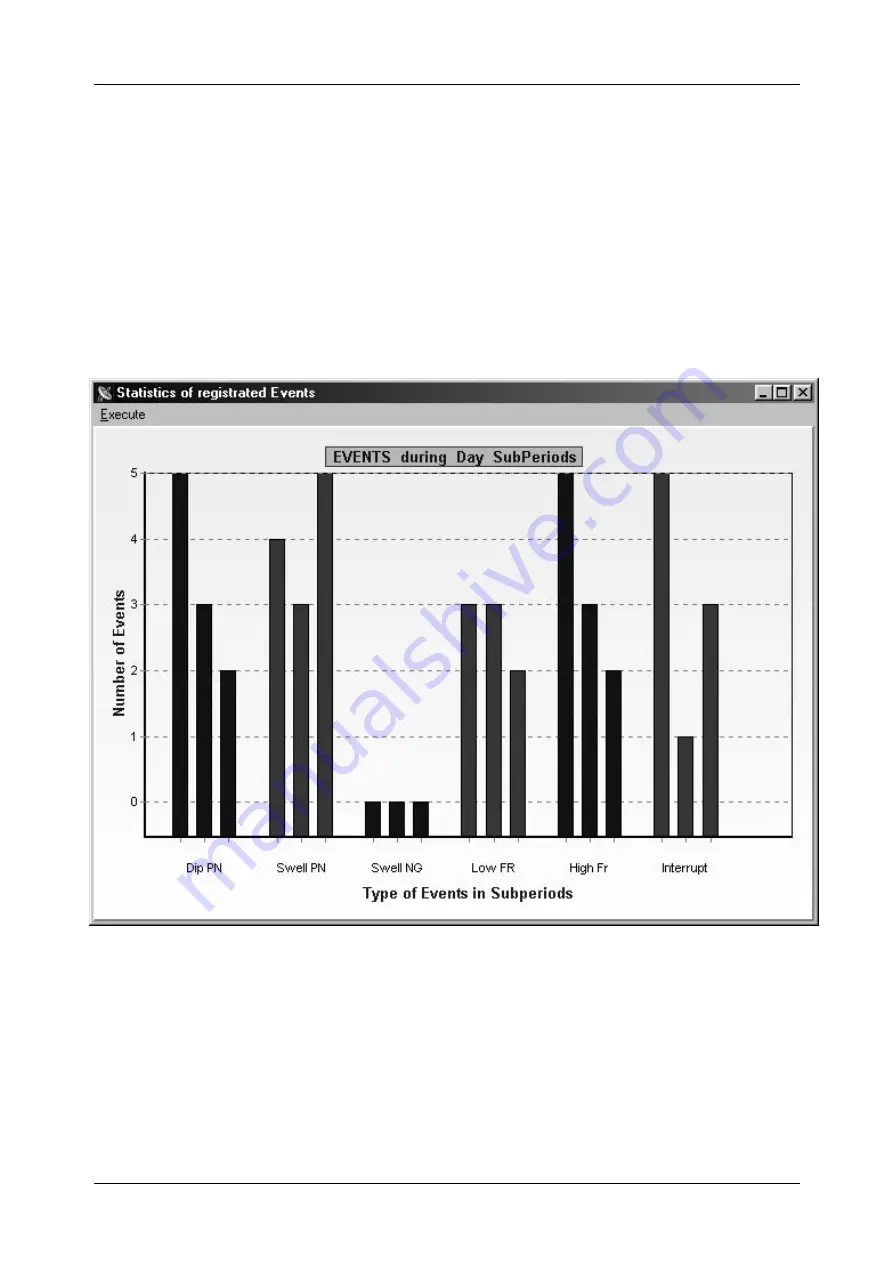
Statistics Graph
This graph is very useful, if you want to determine at which time during the day most
anomalies occur. In the Select and Setup Graph window select the number of day
subperiods. For instance, if you select three subperiods, each type of event will be
represented with three bars in the graph:
•
first bar representing events that occurred between 00.00 and 08.00
•
second bar representing events that occurred between 08.00 and 16.00
•
third bar representing events that occurred between 16.00 and 24.00
Also select if you want to view all data or just a specific time frame which you define
from date to date.


