MI 2130 VoltScanner
Downloading and Analysing Data
25
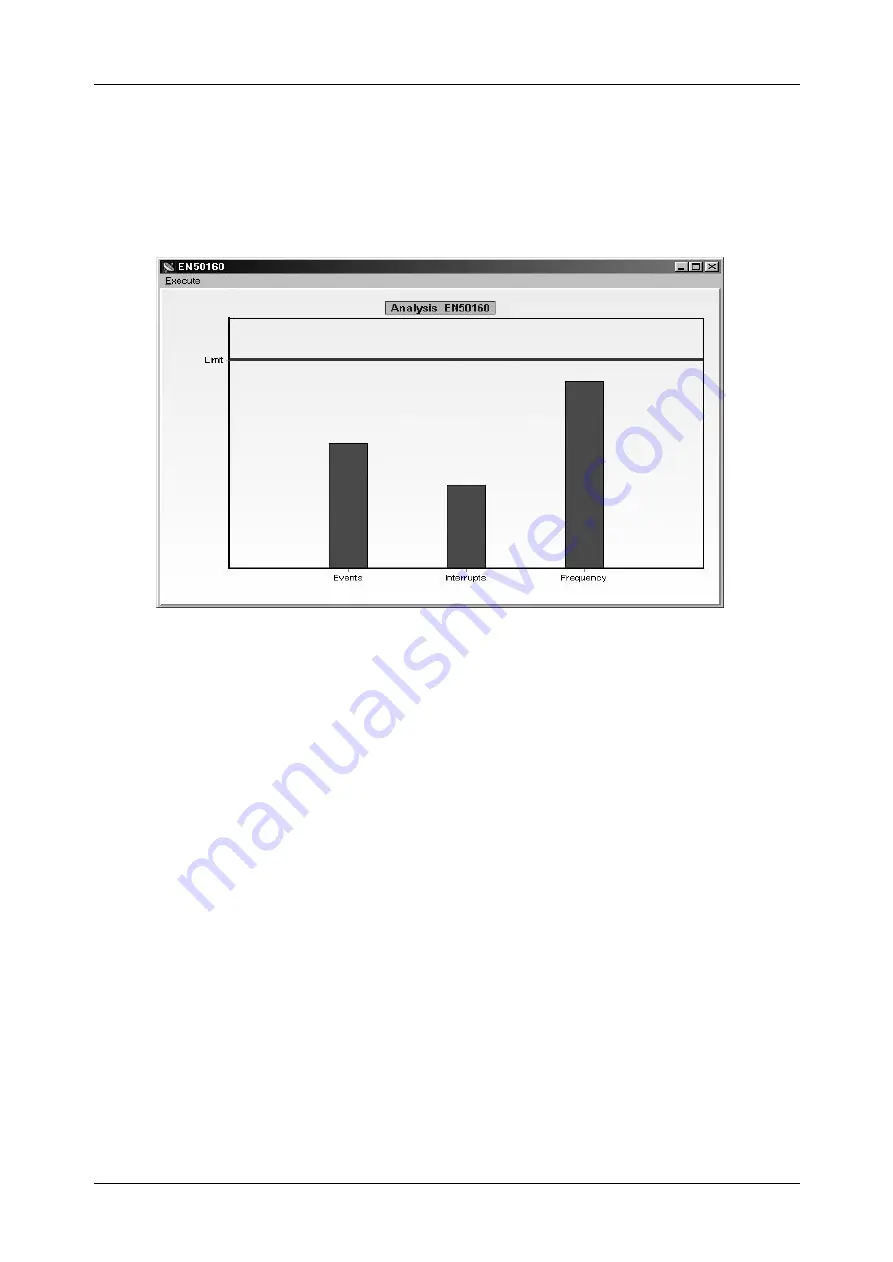
EN 50160 Graph
This bar graph represents the results of EN 50160 analysis. First bar represents the
number of swells and dips, second bar the number of interruptions and third bar the
percentage of frequency values outside ±1% of nominal frequency.
The limit line for first two bars represents 100 events and for the frequency bar it
represents 0.5%.
4.5 Supply Voltage Interruptions
In both Event & Transient and Periodics mode, the VoltScanner also records supply
voltage interruptions. The VoltScanner considers interruption as an event when supply
voltage drops below 90V. After an interruption occurs, the VoltScanner stays active for
the next 3.5 minutes and continues measuring and recording events. This is very
convenient, if an interruption is shorter than 3.5 minutes, which is usually the case. The
VoltScanner can then record all anomalies and irregularities which usually occur at
voltage interruptions and when voltage comes back. If interruption lasts longer than 3.5
minutes, the VoltScanner goes into power down mode, from which it only wakes up
every 8 seconds and checks if line voltage is back.
Duration of interruptions shorter than 3.5 minutes is recorded with one second
resolution, longer interruptions are recorded with 8 seconds resolution.
In the Periodics mode, an interruption is represented as two events: the beginning and
the end of an interruption. Values for the average, min and max are all zeros as shown
in the next picture.


