MI 2130 VoltScanner
Downloading and Analysing Data
23
4.4 Event and Transient graphs
Click the
Graph
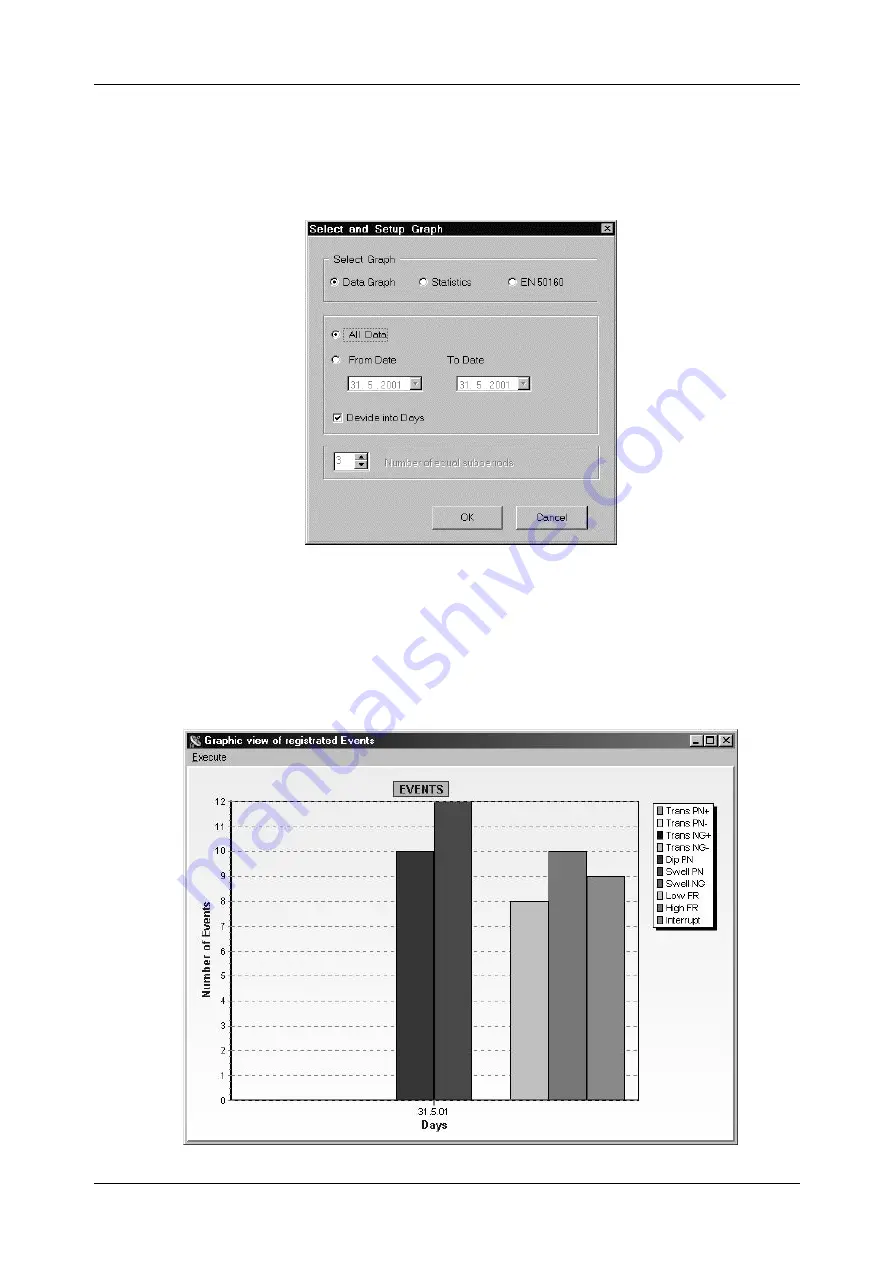
button in the toolbar and the Select and Setup Graph window will open.
You can chose between three different graphs: Data Graph, Statistics and EN 50160.
Data Graph
This graph displays the number of swell, dip, transient, frequency and interruption
events in a bar graph. You can select to view all data or just a specific time frame which
you define from date to date. In both cases you can check the box Divide into Days,
which will divide the whole graph into daily periods. Each period is then basically an
independent graph that displays how many different events have occurred in that
period.


