DO0281R00
50 / 58
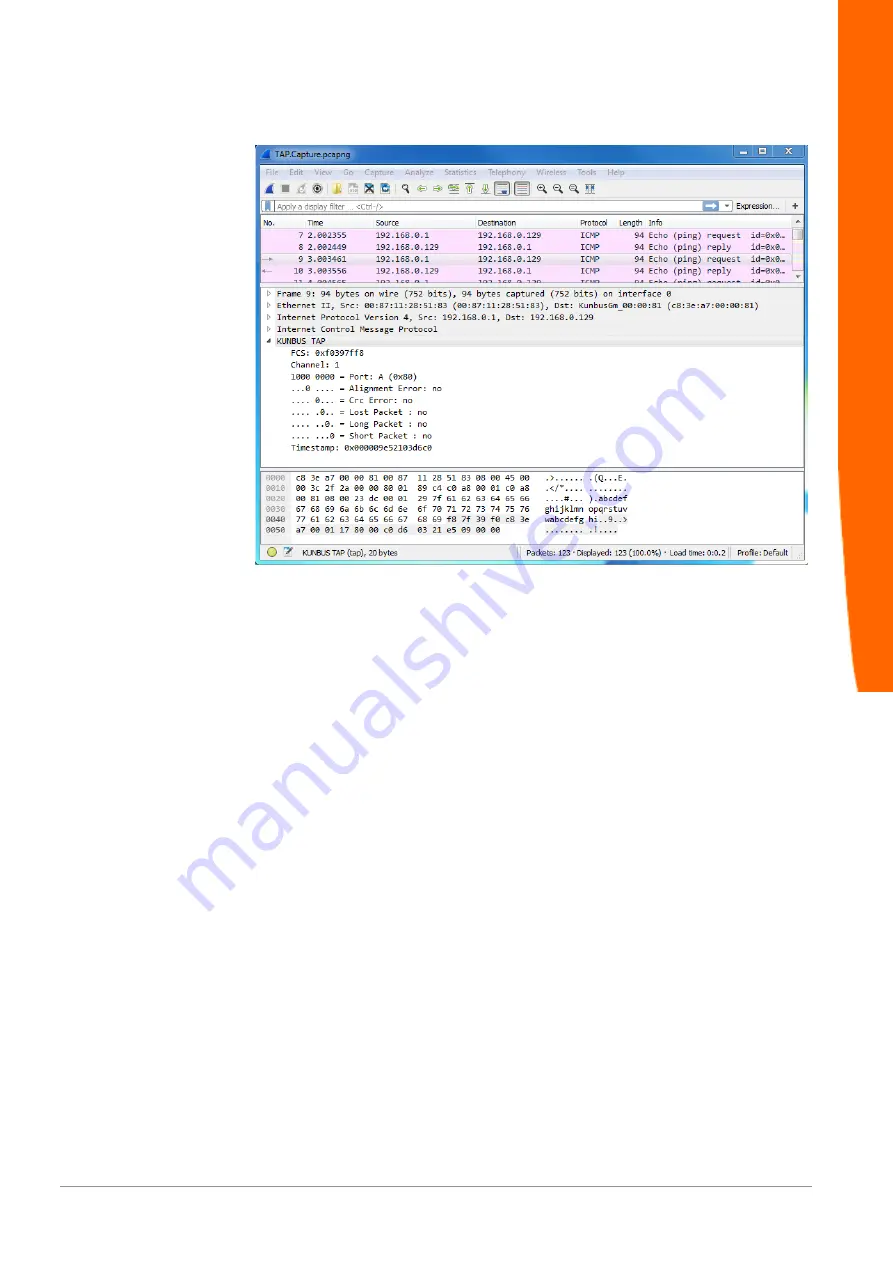
Status window
The status window consists of 3 areas:
– Packet list,
– Packet details,
– Packet raw data.
Packet list
Wireshark displays all data packets in chronological order here. As soon as the
KUNBUS TAP spy plugin is activated, Wireshark will apply in the "Time" column
the highly-precise time stamp from TAP CURIOUS instead of the timestamp from
the operating system.
Specific values from TAP CURIOUS can be displayed in additional columns. Open
the "Edit > Preferences > Columns" menu in the "Properties" section and click on
the "Add" button to create a new column. Now select "Custom" from the drop-down
list.
as the "Field type". You can enter "TAP.port", for example, as the "Field name". As
soon as "TAP." is entered, the plugin will suggest values for selection.
To precisely analyze traces, Wireshark offers a filter function. As a result, the
display and the analysis can be limited to the most informative frames for the
analysis. The filter allows you to observe the inbound and outbound data traffic for
your own IP address or solely ping commands. When using TAP CURIOUS, it
makes sense to filter by TAP additional information. Wireshark uses the filter
expression "TAP.port == a" to show, for example, only those packets that TAP
CURIOUS has received at Port A.
Monitoring the interface


