


28
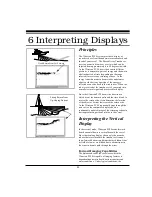
VERT: Vertical Scan Display
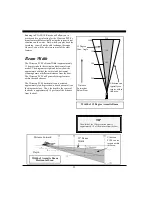
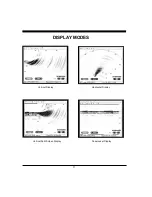
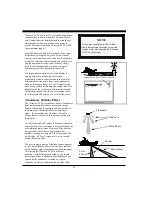
The VERT display shows the image created by
the vertical scanning transducer elements. This
array scans through a maximum of 90 degrees in
a sector starting horizontally in the direction that
the boat is heading and ending vertically beneath
the transducer (see figure at left).
The vertical scan is shown with the transducer at
the upper left corner of the display window with
the selected range extending to the lower right
corner of the window. As a result, the scale bars
will usually indicate maximum distances that are
less than the selected range.
HORZ: Horizontal Scan Display
The HORZ display shows the image created by
the horizontal scanning transducer elements. This
array scans through a maximum of 90 degrees in
a sector centered about the boat’s heading and
tilted downward from horizontal by about 10
degrees (see figure at left, center).
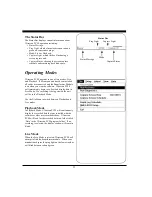
The horizontal scan is shown with the transducer
at the bottom of the display window and the
selected range extending to the top of the
window, regardless of the window’s width. Thus,
data will be clipped on the sides of a tall, narrow
display (see figure at bottom left).
DOWN: Downlooker Display
The downlooker display shows the region directly
beneath the boat over time. The right edge of the
display always shows the most recent ping.
Since Ultrascan PC90 does not know boat speed,
the downlooker display cannot be used to
determine horizontal distances. Thus, there is no
horizontal scale bar in the downlooker display.
Ultrascan PC90 can only extract DOWN data
from the vertical array.
Scanning Directions.
Vertical Scan mode
shown above and
Horizontal Scan
mode below
Summary of Contents for ULTRASCAN PC90
Page 1: ......
Page 5: ...5 Specifications 47 How To Obtain Service 51 9 Advanced Networking Information 48 Warranty 55...
Page 53: ...53 This Page for Notes...
Page 54: ...54 This Page for Notes...
Page 56: ...56...