94
Statistics 2Var app
Fitting a curve
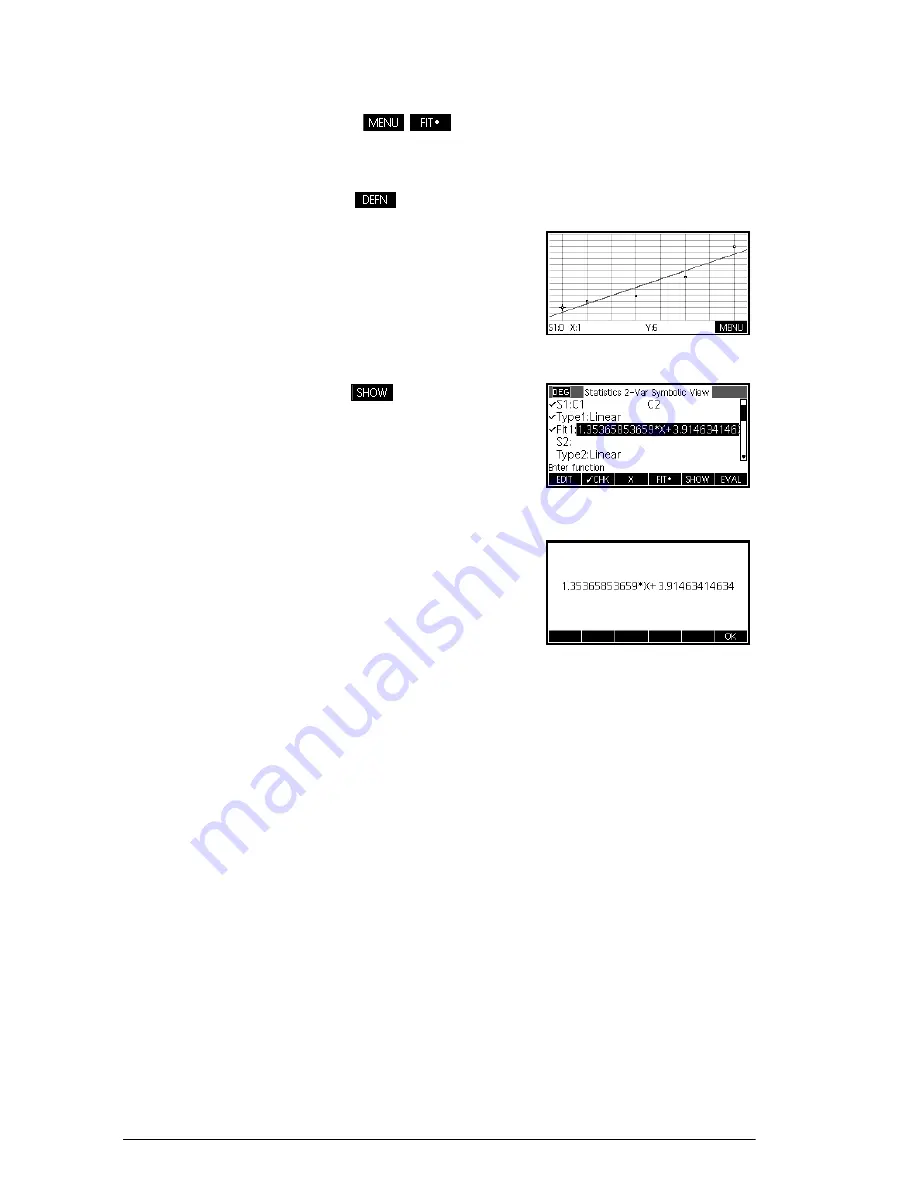
Press
. The graph of the fit will be displayed
with the scatter plot. Press
\
to move the tracer to the
graph of the fit. Press
>
and
<
to trace along the fit
and
to see the equation of the fit.
Press
Y
to see the
equation of the fit in the
Fit1 field. To see the full
equation, highlight the fit
equation and press
The expression in
Fit2
shows the slope
(m=1.98082191781) and
the
y
-intercept
(b=2.26575).
Summary of Contents for 39gII
Page 1: ...HP 39gII graphing calculator user s guide Edition1 Part Number NW249 90001 ...
Page 2: ...Printing History Edition 1 November 201 1 ...
Page 32: ...22 Getting started ...
Page 58: ...48 Apps and their views ...
Page 70: ...60 Function app ...
Page 80: ...70 Solve app ...
Page 136: ...126 Polar app ...
Page 140: ...130 Sequence app ...
Page 148: ...138 Finance app ...
Page 152: ...142 Linear Solver app ...
Page 218: ...208 Matrices ...
Page 226: ...216 Notes and Info ...
Page 238: ...228 Variables and memory management ...
Page 318: ...308 Programming ...
Page 340: ...330 Reference information ...
Page 346: ...vi Product Regulatory Information ...


