141
There are two methods of dealing with this. The first is to use another
measure of goodness of fit. The second is to ‘linearize’ the data (discussed
below). The hp 39g+ provides an alternative measure of goodness of fit via
the
RelErr
value in the
view.
RelErr
as a measure of non-linear fit
RelErr
is defined as the measure of the relative error
in predicted values when compared to data values,
and has the formula shown right. The
ˆ
y
values are
obtained using the
PREDY
function internally. The only drawback to
RelErr
is that there is no upper limit its value of as there is for the correlation
coefficient. The interpretation placed on it is that the closer it is to zero the
better the model fits the data. This value is available for any of the data
models, including the user defined model.
Alternatively, when data is non-linear in nature you can
transform the data mathematically so that it
is
linear. Let's
illustrate this briefly with exponential data.
As you can see, I chose a very simple rule for
the data:
2
x
y
=
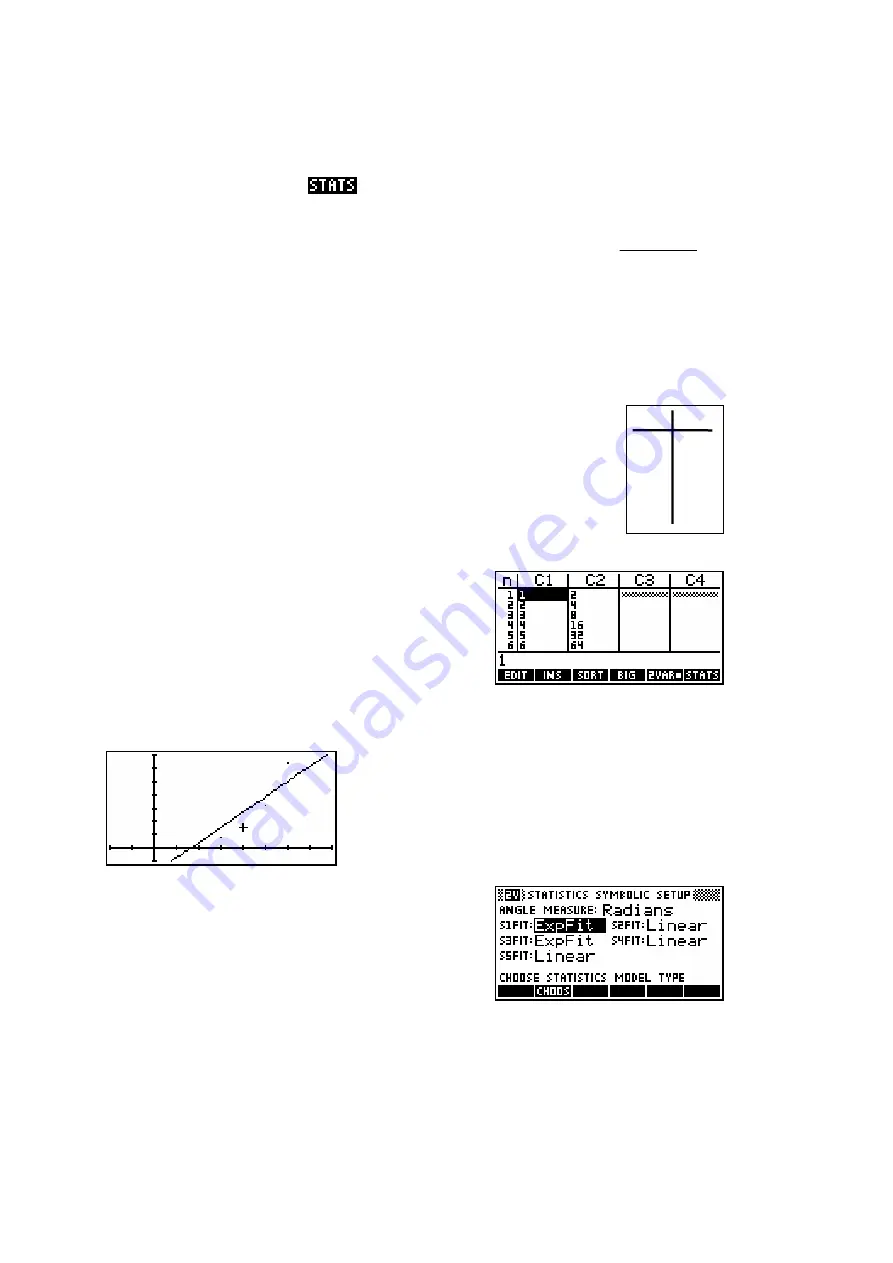
If you set up a linear fit for the data in S1, and then view the bivariate stats,
you will find that the correlation for a linear fit is 0.9058
As you can easily see from the graph left, a
linear fit is not a very good choice.
If we change now to the
SYMB SETUP
view
and choose an Exponential fit rather than a
linear fit then the results are far better.
x
i
y
i
1 2
2 4
3 8
4 16
5 32
6 64
2
1
2
1
ˆ
(
)
RelErr
n
i
i
n
i
i
y
y
y
=
=
−
=
∑
∑


