


109
The
NUM
SETUP
view offers more useful
features. Change to that view now and
change the
NumStep
value to 10. If you then
swap back to the
NUM
view you will see (as
right) that the sequence jumps in steps of 10.
In case you don’t realize…
2.1475E9
is
‘computer speak’ for
9
2 1475 10
⋅
×
.
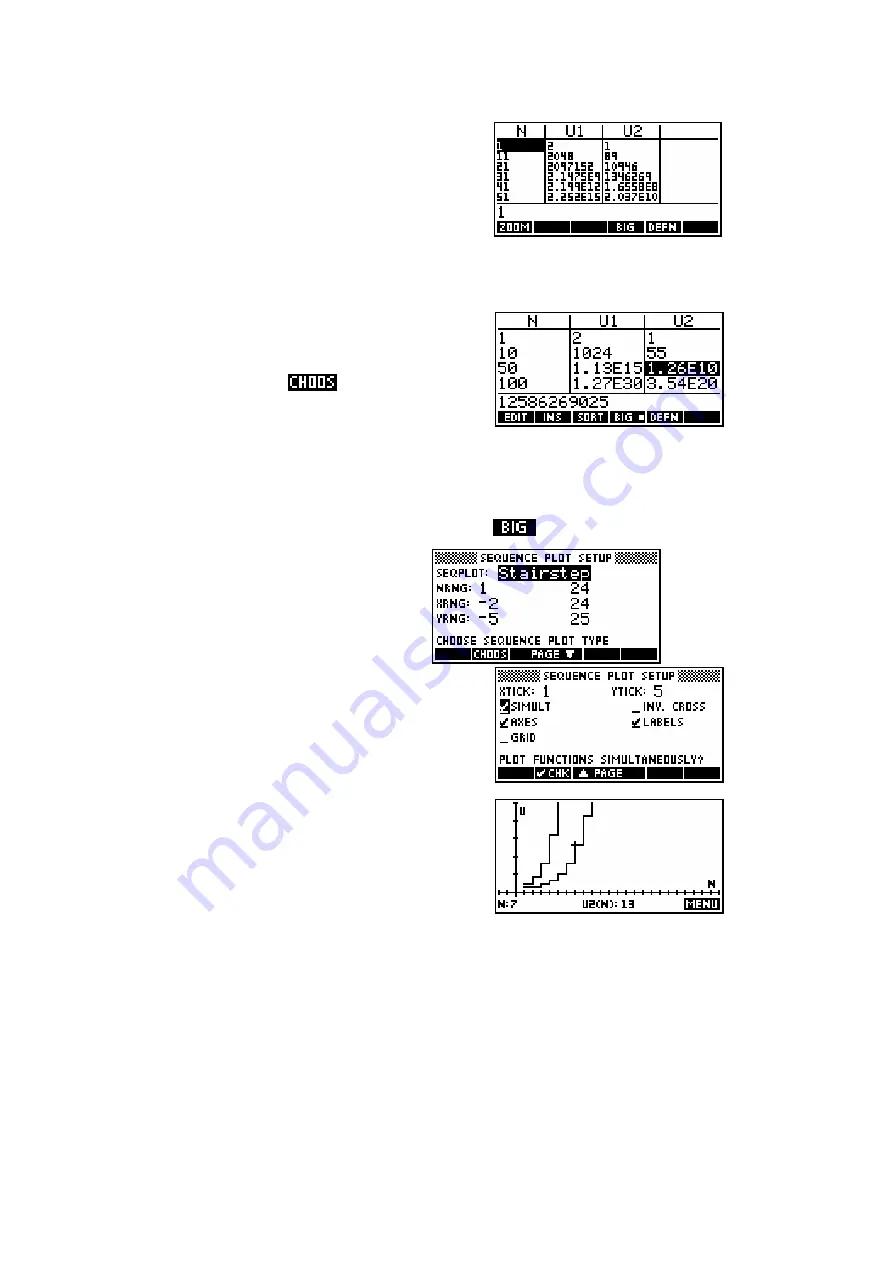
Now go back to the
NUM
SETUP
view and
change the
Automatic
setting to
Build Your
Own
by moving the highlight to it and pressing
the
+
key or by using
. Switch back to
the
NUM
view and enter the values
1
,
10
,
50
and
100
into the
N
column.
You will find that the values for those terms of each sequence will appear in
the
U1
and
U2
columns almost immediately. In case you didn’t realize, the
reason for the larger text is that I have used the
button.
Due to the type of problems one is
usually trying to solve with sequences,
the
NUM
view rather than the
PLOT
view is often more useful in this aplet,
but let's have a look at the
PLOT
view anyway.
Two types of plots are available, the default
being
Stairstep
.
Change to the
PLOT
SETUP
view and ensure
that the setup view is the same as that shown
in the two screens above right. Then change
to the
PLOT
view and you should see a graph
similar to the one shown below right. The
second type of graph is the
Cobweb
.


