ACM 150
22
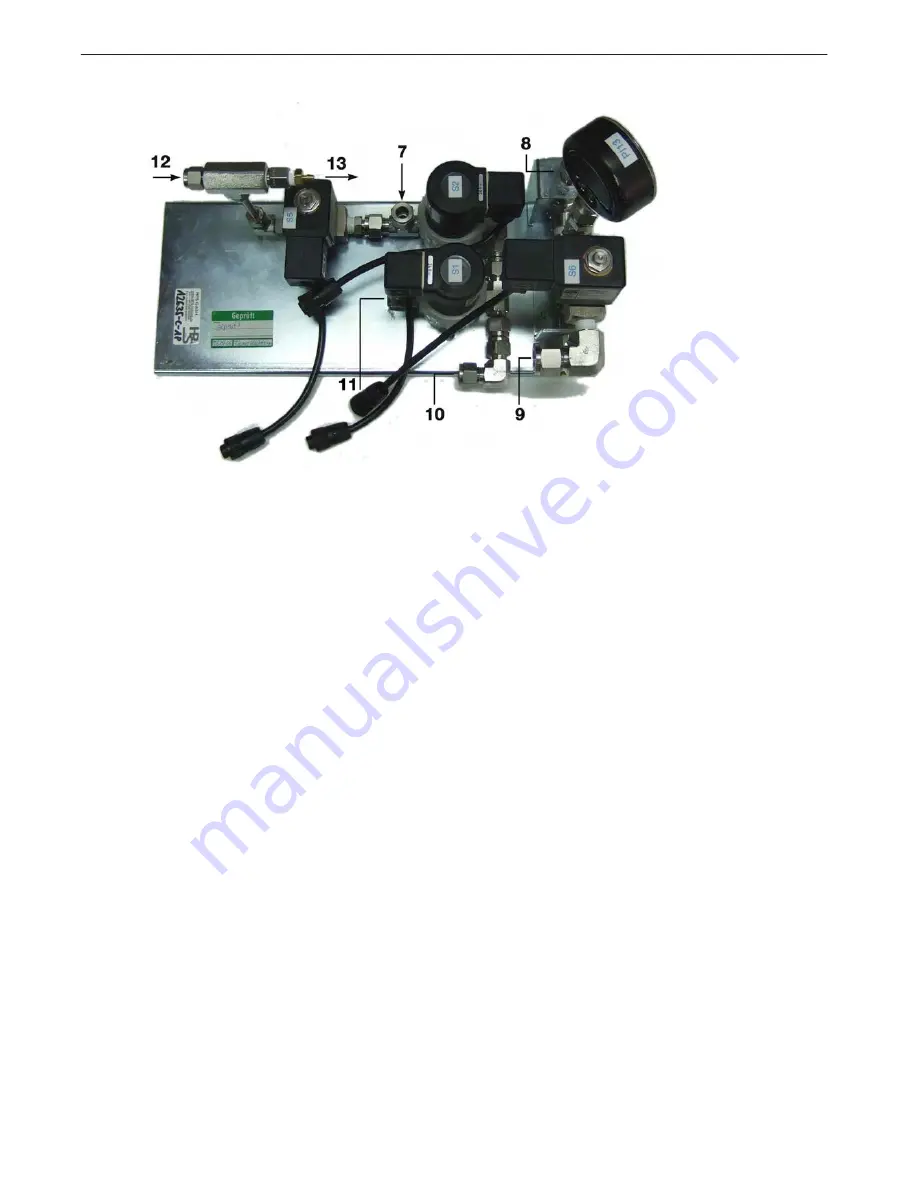
Figure 9. Cycle valve assembly
S1, S2, S5, S6: Solenoid Cycle Valves
PI13 Pressure Indication
7.
Gas Cell In
8.
Gas Cell Out
9.
Depending on option, either / or:
To Venturi Manifold
Exhaust Pump In
10.
From Boost Pump
11.
To Exhaust
12.
Nitrogen In
13.
To Dust Cover Purge
Cycle valve control panel
The Cycle Valve Control Panel provides both status and control, much like the
Sample Valve Control Panel. Status indicators include:
•
Sample Pressure: This scale is psia or absolute pressure, as measured at the gas
cell.
The pressure is lowest during the Evacuation cycle. It peaks during the Analyze
and Background cycles (~ atmospheric or 14.7 psia). The scale is used to confirm
proper operation of the pumps and cycle valves.
•
Cycle Status: LEDs light to show the stages of the scan cycle from Evacuation
to Analyze. The scan cycle is explained in “Air sampling system” on . Green
LED indicates the status is OK. Amber LED indicates a possible problem, i.e.
Summary of Contents for ACM 150
Page 1: ...ACM 150 Air Composition Monitor Guide to Installation Operation and Maintenance ...
Page 2: ......
Page 15: ...ACM 150 15 Figure 1 ACM 150 outside labels ...
Page 16: ...ACM 150 16 Figure 2 ACM 150 inside labels ...
Page 29: ...ACM 150 29 Figure 15 Relay output board ...
Page 59: ...ACM 150 59 Figure 30 Installation diagram ...
Page 152: ...ACM 150 152 ...
Page 153: ......
Page 154: ......
Page 155: ......
Page 156: ...ACM 150 Air Composition Monitor Revision 2 ECO HAA150063 December 2015 Honeywell Analytics ...


