


12
80415F_MSW_GFX4-IR_05-2019_ENG
0
470
P.V.
R
Read of engineering value of
process variable
(PV)
Input filters
24
flt
R/W
Low pass digital filter
on input signal
0.0 .... 20.0 sec
0.1
Sets a low pass
digital filter
on the main input, running the average value read in the
specified time interval. If = 0 exclude the average filter on the sampled values.
179
fld
R/W
Digital filter on oscillations
of input signal
0.0 ... 9.9
scale points
0.5
Introduces a hysteresis zone on the input signal value within which the signal is considered
unchanged, thereby increasing its apparent stability.
85
Err
R
Self-diagnostic error code
of main input
0 No Error
1 Lo (process variable value is < Lo.S)
2 Hi (process variable value is > di Hi.S)
3 ERR [third wire interrupted for PT100 or input values below minimum
limits (ex.: for CT with connection error)]
4 SBR (probe interrupted or input values beyond maximum limits)
Error code table
ADVANCED SETTINGS
Linearization of input signal
The modular power controller lets you set a custom linearization of the signal acquired by the main input for signals coming
from sensors and for signals coming from custom thermocouples.
Linearization is performed with 33 values (S00 ... S32: 32 segments).
S33, S34, S35 are an additional 3 values to be inserted in case of linearization with custom CT.
- Signals from sensors
For signals coming from sensors, linearization is done by dividing the input scale into 32 zones of equal dV amplitude, whe-
re:
dV = (full-scale value – start of scale value) / 32
Point 0 (origin) corresponds to the engineering value attributed to the minimum value of the input signal.
Subsequent points correspond to the engineering values attributed to input values equal to:
Input value (k) = Minimum input value + k * dV
where k is the order number of the linearization point
For custom linearization (tYP = 28 or 29):
- LO is signaled with input values below Lo.S or at minimum
calibration value.
- HI is signaled with input values above Lo.S or at maximum
calibration value.
Read state
Scale of the visualized engineering value
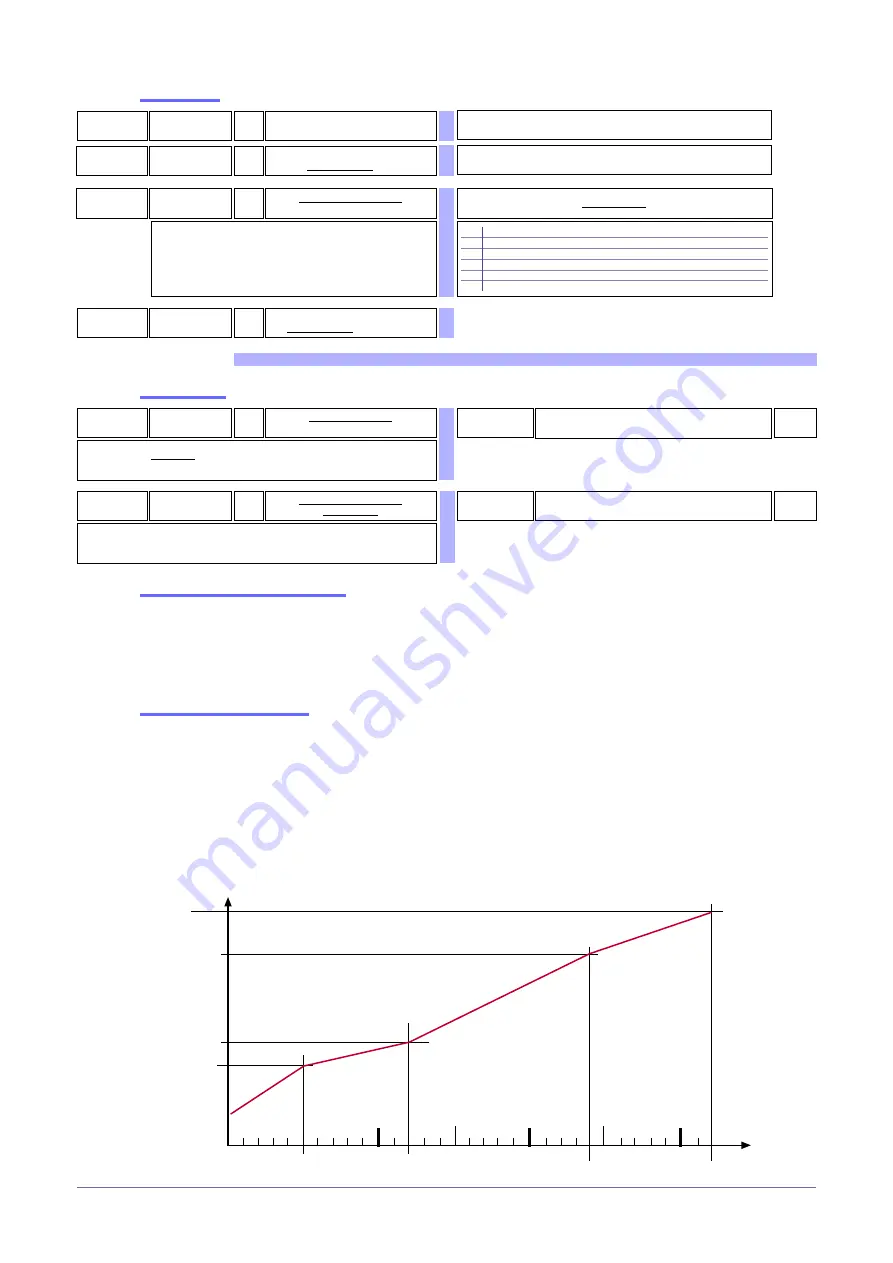
Example of linearization:
S.32
S.24
S.12
S.00
...
...
S.05
...
0
9.375mV = 5 * (f.s./32)
22.5 mV
45 mV
f.s. = 60 mV
Ex.: Input 0...60mV
349
DPV
R
Read of engineering value of
process variable
filtered by
Fld
770
In.
1
R
Main input value


