S
1
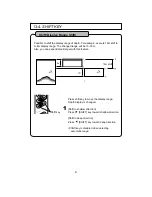
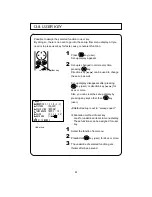
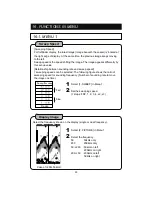
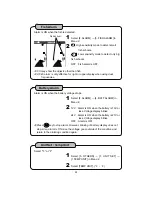
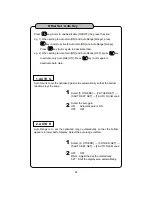
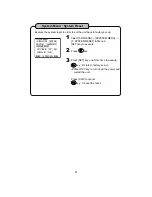
elect [3. SCALE LINE] in Menu 1.
S
O
et the scale line.
N : Enable
OFF : Disable
Horizontal lines appear at the depth scale.
2
Scale Line
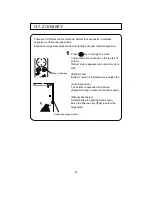
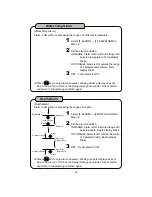
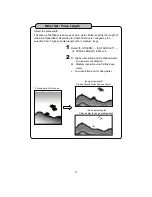
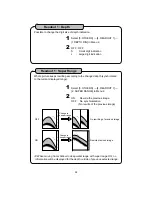
Water Temp Graph
Water temp graph appears. It
’
s easy to see the fishing points by knowing the
variation of water temperatur
tide change.
e and
1
2
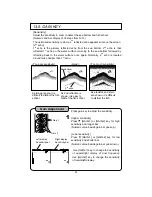
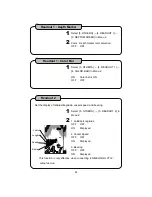
Color Configuration
S
1
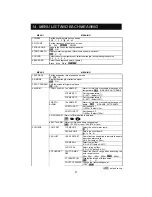
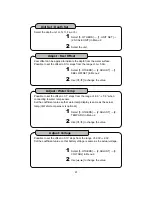
elect [5. COLOR] in Menu 1.
Select the color configuration. (6 levels:1~6)
Reflected signal of sound wave is converted into 17 ranks of digital signals
according to the strength of response. Color configuration is the color set-up for
16 ranks except background color.
Fishfinder image is shown by the color configuration. The displayed color shows
the strength of reaction. Also, the whole image may vary with this set-up.
2
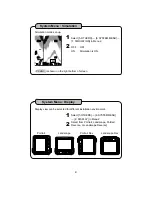
Background Color
S
1
elect [6. BACK GRD] in Menu 1.
Select the background color.
(black, blue, white, or dark blue)
Visual image of display looks differently by surrounding brightness. It is easier
to see the image by selecting the background color from 4 different colors.
2
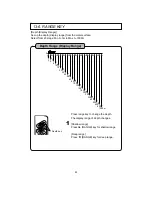
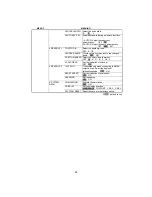
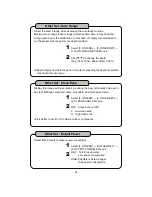
Select [4. TEMP GRAPH] in Menu 1.
Set the water temp graph.
OFF : No graph
2° : Display the temp of 2
℃
range.
10° : Display the temp of 10
℃
range.
※
Optional water temp sensor is required to show temp graph.
31

